large

Fungi diversity assessment under different tree species of Shere Hills soils in Jos North Local Government Area Plateau State, North Nigeria

A. S. Popoola, M. S. Chomini*, N. Janfa, M. J. Francis, C. Kambai, T. A. Erhabor, Y. E. Sadiku, J. A. Imoh, C. J. Ukanyirioha, M. Ukwadi, A. M. Kabir

Department of Forestry Technology, Federal College of Forestry Jos P.M.B 2019, lateau State, Nigeria

Address for correspondence: M. S. Chomini, Department of Forestry Technology, Federal College of Forestry Jos P.M.B 2019, lateau State, Nigeria. E-mail: stevemchoms@gmail.com
Submitted: 27-05-2021, Accepted: 01-06-2021, Published: 30-06-2021

ABSTRACT

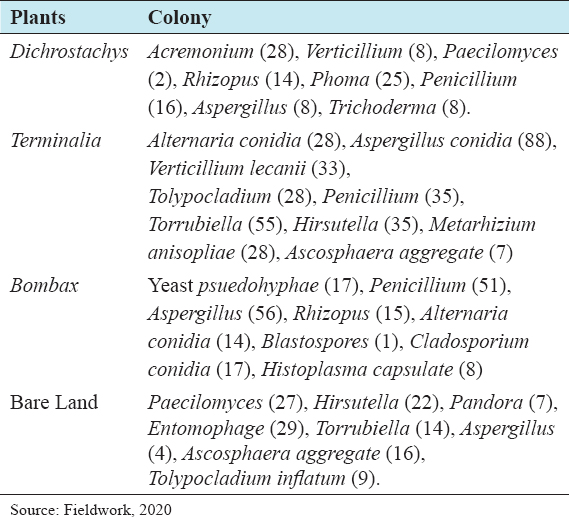
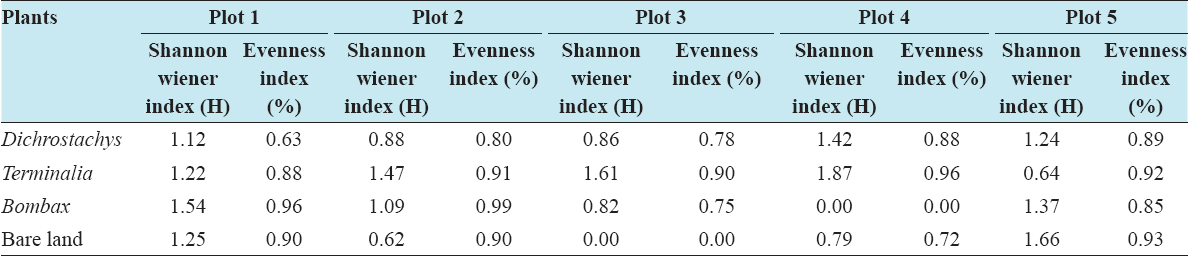
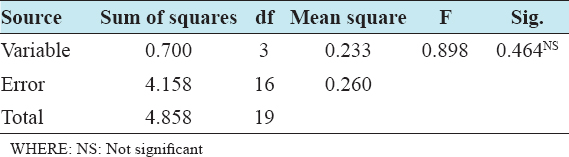
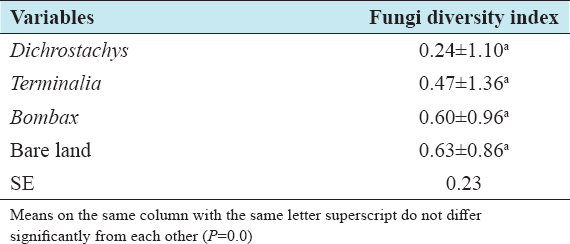
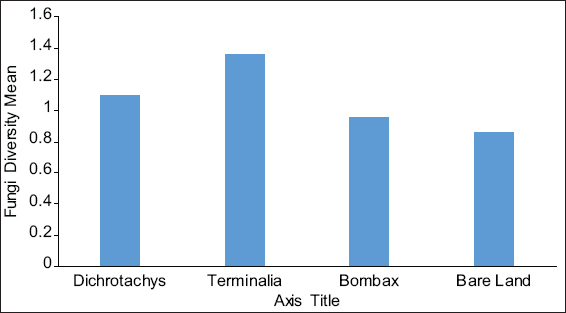
This study assessed the fungi composition under three different forest tree species cover and bare land in Shere Hills Jos, North Nigeria. Plants species considered are Dichrostachys, Terminalia, and Bombax. Two meters by 2 m plot under forest cover and adjacent open area were set up. Fungi species diversity indices (Shannon-Wiener index and species evenness) were calculated. Results revealed that there were 49 species distributed into 28 families (293 individuals) under the tree cover, while there were 53 species distributed into 33 families (451 individuals) in the open vegetation. The Jaccard index of similarity (79.49%) was high between the study sites. The result of this study showed that forest cover has a beneficial effect on soil properties and nutrient pool. Plants species richness and microbes population were also higher under the forest cover than in the open area. Species diversity and richness, soil nutrient, and microbial population were greatly influenced by forest cover.

Keywords: Soils, fungi, Shere Hills, diversity, tree species, plate count


INTRODUCTION

The forest canopy is defined as “the top layer of a forest or wooded ecosystem consisting of overlapping leaves and branches of trees, shrubs, or both.”[1] Forest canopy is also frequently explained as the percentage area occupied by the vertical projection of tree crowns; a proportion of the forest floor covered by the vertical projection of the tree crowns.[2] The tree canopy is very important in that it modulates the availability and variability of some key resources for the organisms living in the understorey, thus affecting its own regeneration.[3] Plant species can influence the composition of underlying soil microbial communities.[4] These influences can be due to differences in forest cover, rooting depth, and litter quality and quantity[5] or to secondary effects on soil pH, moisture, and nutrient levels. Microbes (bacteria, archaea, fungi, and protozoan) are very important in all processes related to soil function.[6] The microbial constituents of soil are entirely responsible for the breakdown of organic matter and the degradation of toxic molecules.[7] Overall, denser forest cover implies higher rate of respiration.[8]

Forest canopies contain a major portion of the diversity of organisms on earth and constitute the bulk of photosynthetic active foliage and biomass in forest ecosystems.[1] Soils are highly diverse habitats that mediate biogeochemical processes of global importance, yet our understanding of how these functions are influenced by microbial biodiversity is only slowly advancing. At present, microbial community composition is an important determinant of ecosystem process rates and identifying microbial community composition has become an essential component for predicting ecosystem responses to environmental change. Furthermore, it is essential to simultaneously study the bacterial and fungal communities in soil to understand microbial influences on ecosystem processes, because these communities mediate different ecological functions in soil.[8]

This study was carried out in order to provide information on fungi diversity in soils under tree canopy of major tree species in Shere Hills. The specific objectives of this study are to produce a checklist of fungi in the various soil samples and compare the fungi diversity across different tree species and plots on the field.

MATERIALS AND METHODS

Study Site

Shere Hills are located in Jos, Plateau situated about 10 km to the East of Jos metropolis the capital of Plateau State in the middle belt region of Nigeria with a latitude of 9°571N 9°031E and longitude 9.950°N 9.050°E and have an elevation of 1829 m (6001 ft) above sea level, the Shere Hills are the highest point of the Jos Plateau and they farm the third highest point in Nigeria after the Chappal Waddi on the Mambilla Plateau averaging about 2419 m or 7936 feet above sea level and mount Dimlang (Vogel peak) on the Shebshi mountains reaching a height of about 2042 m or 6699 feet above sea level.[9]

Sampling Procedures

The study was conducted in Shere Hills, Jos North, Plateau State, Nigeria. Three tree species covers were selected within the Shere Hills forest. Two meters by 2 m plot were marked out within each of the three tree cover using a measuring tape. Three other points (open area) were selected adjacent to each of the tree cover at a distance of 5 m away from the tree canopy (open area), where 2 m by 2 m plot was also marked out. This study was carried out between August and September 2020, the peak of the raining season because it is expected that the plant growth will be at its peak. The species that form the forest cover used in this study were Dichrostachys, Terminalia, and Bombax.

Determination of the Fungi Population

The assessment of the soil sample for fungi count was determined by standard pour plate method as described by Nwachukwu and Akpata (2003).[10] Culturing, inoculum from serial dilution of the same soil suspension, was transferred into sterile Petri dishes followed by sterile molten Sabouraud Dextrose agar of 40–42°C, mixed, allowed to solidified, and incubated in an incubator at 25°C for 5 days. Growth of microorganism was observed after incubation period and the population determined by standard microbiological method putting into consideration the dilution factor.[10]

Data and Statistical Analysis

A number of fungi species (i.e., species richness), genera, and families were established for each plot. The Simpson index of diversity (1-D) was also calculated

thumblarge

Where, N is the total number of individual species present at the study sites and n is the number of species present at the study sites. Fungi species diversity index H’ of each sample plot was calculated using the method prescribed by.[11]

thumblarge

Where, Pi = ni/N is the relative abundance proportion of i species and ln = Natural logarithm N is the total number of individuals present at the study sites. ni is the number of species present at the study sites

The degree of similarity in species composition between open and cover area was compared using Jaccard index of similarity (J):

thumblarge

Where, j is the number of species found in both cover and open plots and r is the number of species found in each of the plots added together except common species in the two sites (i.e., number of species found in only one or the other).

The evenness index[12]was calculated thus:

thumblarge

Where, S is the total species number in each site H’ is the diversity index and Ln = natural logarithm.

RESULTS AND DISCUSSION

Fungi Encountered and Abundance in the Study Area

The details of the differences in the number of fungi found under individual plant species of focus and on the bare land in Shere Hills are presented in Table 1. The study revealed that the following species Sporangium (159), Paecilomyces (27), Hirsutella (22), Entomophage (29), and Ascosphaera aggregate (16) were dominant in the open area (Bare land), while Acremonium (28), Sporangium (20), Phoma (25), Penicillium (16), Aspergillus Alternaria conidia (28), Aspergillus conidia (88), Verticillium lecanii (33), Sporangium (63), Tolypocladium (28), Penicillium (35), Torrubiella (55), Hirsutella (35), Metarhizium anisopliae (28), yeast Psuedohyphae (17), Penicillium (51), Aspergillus (56), Sporangium (37), and Cladosporium conidia (17) are the dominant fungi in the area underneath the forest cover [Table 1]. A total number of 1032 fungi count were recorded with the highest fungi count of 400 observed under Terminalia tree canopy, followed by Bombax and bare land recorded the least number of fungi across the study area.

Table 1: Comparison of fungi composition and number encountered across the study sites.

thumblarge

Diversity and Evenness of Fungi Colony

The result on diversity and evenness of fungi colony as revealed in Table 2 shows that plot four had the highest value for fungi diversity (H = 1.42) for Dichrostachys. This was followed by plot five with diversity of 1.24, plot one (H = 1.12), and plot two (H = 0.88) while plot three was the least with a diversity of 0.86. The highest value of diversity of fungi colony for Terminalia was seen in plot four (H = 1.87), this was followed by plot three with diversity of 1.61, plot two (H = 1.47), and plot one (1.22) while plot five was also the least with a diversity of 0.64. The highest value for fungi diversity on Bombax was seen in plot one (H = 1.54), this was followed by plot five with diversity of 1.37, plot two (H = 1.09), and plot three (0.82) while plot four was also the least with a diversity of 0.00. The colony of fungi diversity found on bare land shows highest value in plot five with a diversity of (H = 1.66), this was followed by plot one with diversity of 1.25, plot four (H = 0.79), and plot two (0.62) while plot three was also the least with a diversity of 0.00.

Table 2: Summary characteristics of fungi diversity among different plots

thumblarge

The result on fungi colony evenness for Dichrostachys shows highest value (J’ = 0.89) in plot five. This was closely followed by plot four (J’ = 0.88), plot two (J’ = 0.80), and plot three (J’ = 0.78) and plot one was the least with J’ = 0.63. On Terminalia, evenness of fungi value was highest (J’ = 0.96) in plot four, this was followed by plot five (J’ = 0.92), plot two (J’ = 0.91), plot three (J’ = 0.90), and the least on plot one with value of J’ = 0.88. The result on species evenness for Bombax shows highest value (J’ = 0.99) in plot two, this was followed by plot one (J’ = 0.96), plot five (J’ = 0.85), plot three (J’ = 0.75), and the least on plot four with least value of J’ = 0.00 while the colony of fungi found on bare land shows highest value in plot five with evenness value of J’ = 0.99, this was followed by plot one and two (J’ = 0.90), respectively, plot four (J’ = 0.72), and the least on plot three with least value of J’ = 0.00 [Table 2].

The study shows that there was no significant difference between the fungi diversities across the different plots (P≤0.05) [Table 3]. The Fungi diversities under Dichrostachys, Terminalia, Bombaxand on bare ground were not significantly different (P≤0.05) [Table 4] with means values as shown in Figure 1.

Table 3: Analysis of variance of fungi diversity across different plots

thumblarge

Table 4: Standard deviation±mean effects of fungi diversity across different plots

thumblarge
thumblarge

Figure 1: Mean effects of fungi diversity across different plots

DISCUSSION

Soil microbial communities are an integral component of many ecosystem processes.[13] The microbial population of the area underneath the tree cover was found far higher than those of the area outside tree cover. Woody plant canopies alter the microenvironment and physical and fertility conditions of soil.[14] Trees modify microenvironment in terms of reduced soil and air temperatures, wind speed, and irradiation, resulting into reduced soil water evaporation and increased relative humidity.[15] It has also been pointed out that trees also acquire nutrients from deeper soil layers and redistribute them at the surface through litter fall which enhances soil carbon and nutrients. All these may create a favorable condition that benefits microbial activity[16] have also reported that soil water and temperature were influenced by tree cover litter accumulated and this creates a favorable condition that enhances microbial activity. Most microorganisms (such as fungi) thrive best in a narrow pH range near neutrality, between pH 6.5 and 7.5; very few thrives below pH 4.0.

The relative abundance of the fungi encountered in the areas underneath cover is indication that soils underneath forest cover is rich in biodegradable organic matters and these are very important in humus formation. This might have accounted for the usual fertile land underneath tree cover. In addition, excretions from soil microorganisms affect water and air movement within the soil. In the course of this study, it was observed that worm casts are more common in the areas underneath tree cover compared to the open area. This is an indication of the higher breaking down of organic matter underneath the tree cover[17] reported that some fungi function largely in the breakdown of complex organic molecules like lignin (a compound that is resistant to bacteria degradation).

CONCLUSION

The study revealed that the number of fungi recorded under the tree cover was higher than those found in the open area. Terminalia tress also recorded the highest number of fungi when compared with other tree canopies and the bare land. The families fungi most abundantly represented in the area underneath the forest cover are Acremonium, Phoma, A. conidia, A. conidia, V. lecanii, Tolypocladium, Penicillium, and M. anisopliae while the families most abundantly represented in the open areas are Paecilomyces and Entomophage. The Jaccard index of similarity indicated high similarity in richness, composition, and relative abundance between the two study areas. It is, therefore, suggested that strong regulatory measures should be put in place and also effort to reestablish the depleted tree species populations should be encouraged. Disturbance, especially through human activities, should be discouraged or completely avoided because of their negative impacts on plant species diversity, nutrients availability, and microbial population.

ACKNOWLEDGMENT

The provost of the Federal College of Forestry, Jos and the Shere Hills community toward the success of this work are duly acknowledged.

CONFLICTS OF INTEREST

There are no conflicts of interest during this study.

REFERENCES

1.  Margaret D, Loman PK, Wittman K. Forest canopies:Methods, hypotheses and future directions. Ann Rev Ecol Evol Syst 1996;27:55-81.

2.  Rautiainen M, Stenberg P, Nilsson T. Estimating canopy cover in scots pine stands. Silva Fenn 2005;39:137-42.

3.  Washburn CS, Arthur MA. Spatial variability in soil nutrient availability in an oak-pine forest:Potential effects of tree species. Can J Forest Res 2003;33:2321-30.

4.  Garbeva PJ, Postma J, Van Veen A, Van Elsas JD. Effect of above-ground plant species on soil microbial community structure and its impact on suppression of Rhizoctonia solani AG3. Environ Microbiol 2006;8:233-46.

5.  Gregory PJ. Roots rhizophere and soil:The route to a better understanding of soil science. Eur J Soil Sci 2006;57:2-12.

6.  Adekunle VA, Dafiwhare HB. Diversity and abundance of microbes, pH and organic matter in soils of different forest types in tropical humid lowland forest ecosystem Nigeria. J Biodivers Ecol 2008;1:333-42.

7.  Forsyth MH. Microbial Diversity in Virginia Old Hardwood Forest Soil Week #1 Bio 203 Laboratory Module. United States:Virginia State University;2009. 14.

8.  Hibbard KA, Law BE, Reichstein M, Sulzman J. An analysis of soil respiration across northern hemisphere temperate ecosystems. Biogeochemistry 2005;73:29-70.

9.  Olowolafe EA. Soil parent materials and soil propèrties in two separate catchment areas on the Jos Plateau, Nigeria. Geo J 2002;56:201-12.

10.  Nwachukwu SC, Akpata TV. Principles of Quantitative Microbiology. Lagos, Nigeria:University of Lagos Press;2003. 77.

11.  Shannon CE. Wiener W. The Mathematical Theory of Communication. Urbana:University of lllinois Press;1963. 117.

12.  Pieolou EC. Species diversity and pattern diversity in the study of ecological succession. Theoretic Biol 1966;10:370-83.

13.  Jackson RB, Fierer N, Schimel JP. New directions in microbial ecology. Ecology 2007;88:1343-4.

14.  Weltzin JF, Coughenour MB. Savanna tree influence on understory vegetation and soil nutrients in Northwestern Kenya. J Vegetat Sci 1990;1:325-34.

15.  Jose S, Allen SC, Nair PK. Tree crop interactions lessons from temperate alley-cropping systems, In:Batish DR, Kohli RK, Jose S, Singh HP, editors. Ecological Basis of Agroforestry. Boca Raton, FL:CRC Press;2008.

16.  Gallardo A, Schlesinger WH. Factors determining soil microbial biomass and nutrient immobilization in desert soils. Biogeochemistry 1995;28:55-68.

17.  Ford PL, Potter DU, Pendleton B, Ribbie WA, GottfriedGJ. Southwestern grassland ecology. In:Finch DM, editor. Assessment of Grassland Ecosystem Conditions in SW United States. Vol. 135. United States:Forest Service General Technical Report RMRS-GTR;2004. 18-48.