large

Geophysical assessment of soil erodibility using 2D and 3D electrical resistivity imaging: A case study of Mela Road, Uselu, Benin city, South-South Nigeria

O. J. Airen1*, T. Akeredolu2

1Department of Physics, Faculty of Physical Sciences, University of Benin, Nigeria, 2Department of Animal and Environmental Biology, Faculty of Life Sciences, University of Benin, Nigeria

Address for correspondence: O. J. Airen, Department of Physics, Faculty of Physical Sciences, University of Benin, Nigeria. E-mail: osariere.airen@uniben.edu
Submitted: 09-11-2020, Accepted: 10-12-2020, Published: 30-12-2020

ABSTRACT

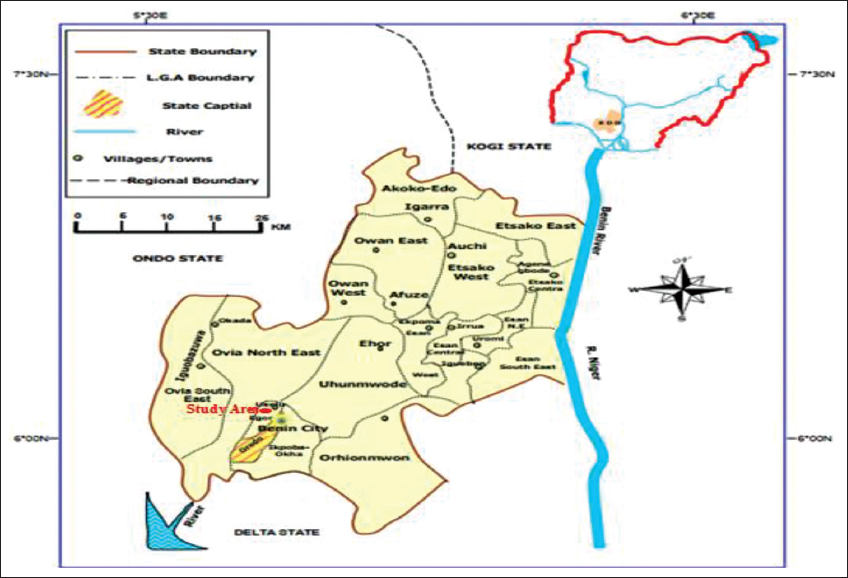
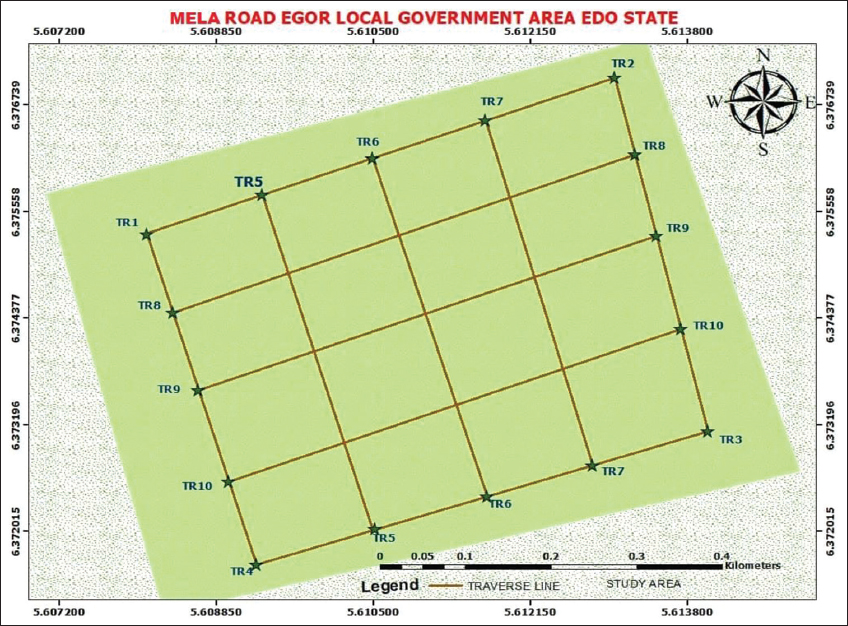
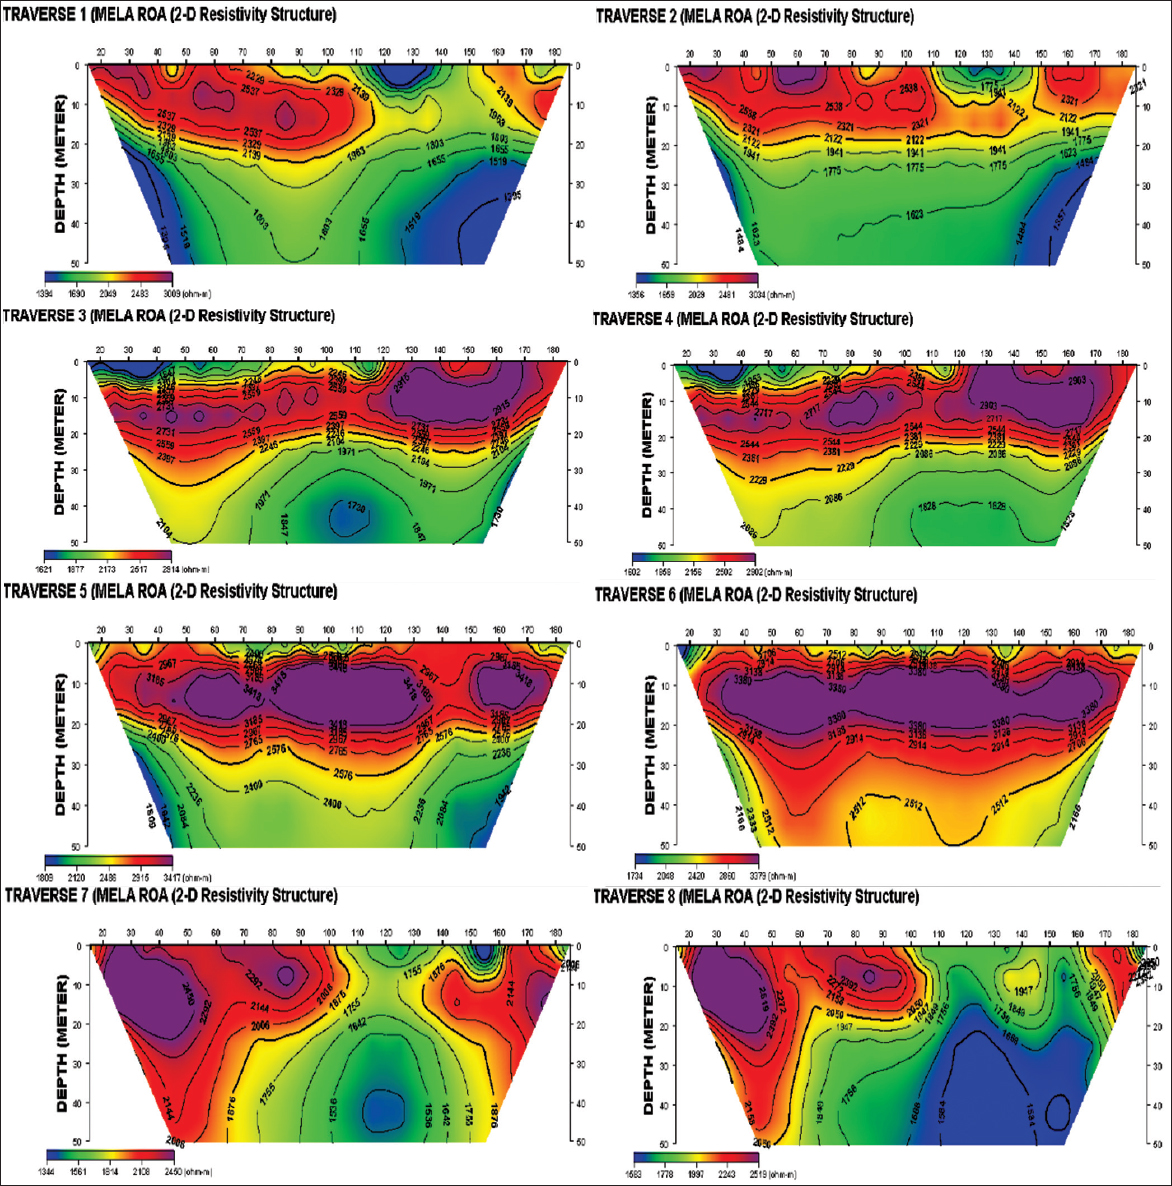
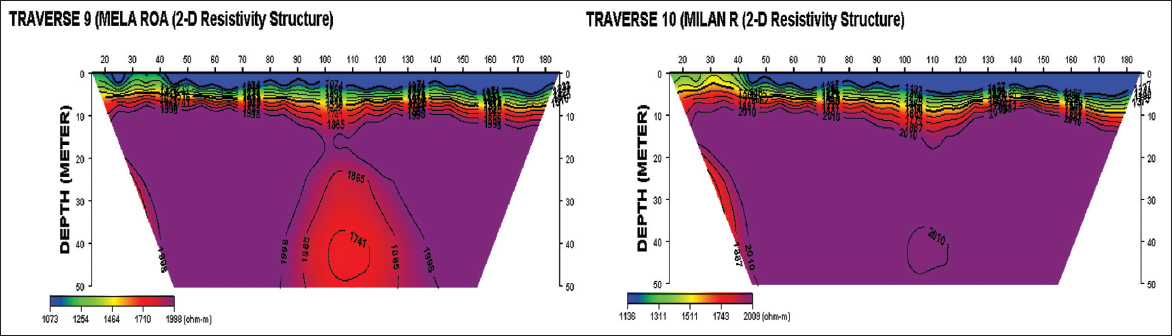
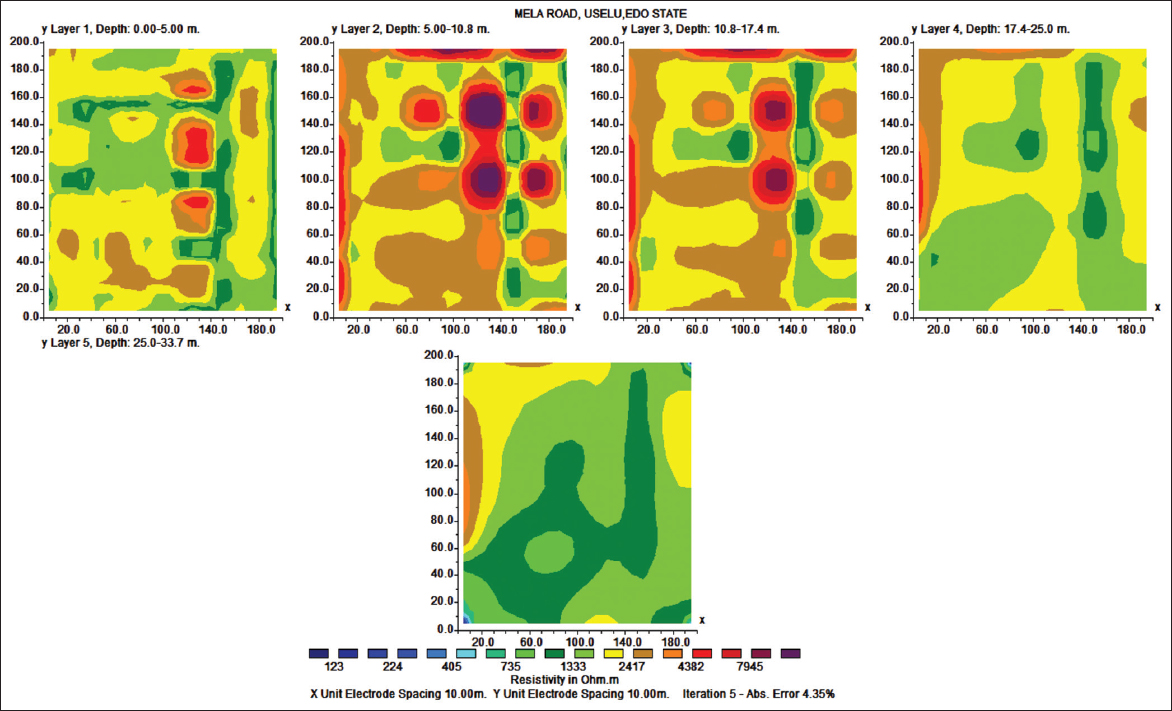
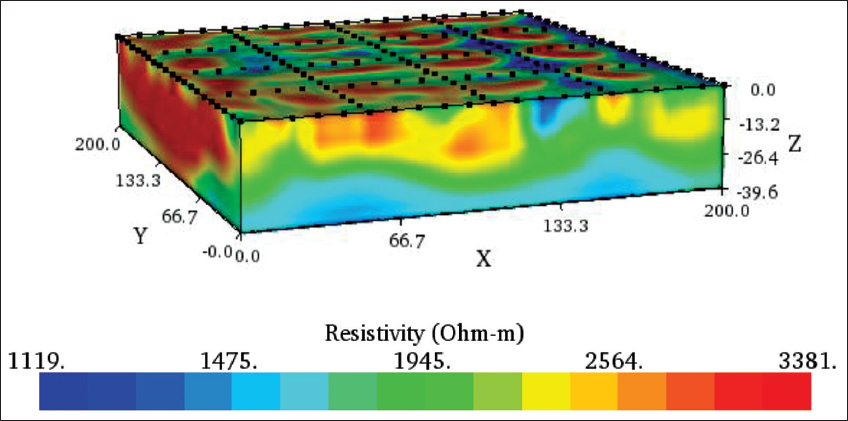
Scouring is a recurrent problem around road infrastructures in Uselu community. Geophysical investigation of the near surface using the 2D and 3D electrical resistivity imaging (ERI) was carried out, therefore, to assess the soil erodibility with a view to proffering a mitigation measure to the problem. A total of 10 traverses, 200 m long each were occupied in grid format using the Wenner electrode configuration. 2D Wenner resistivity data were acquired along each traverse. The data were inverted to reveal a spatially continuous resistivity distribution in 2D and 3D near surface in the study area. The 3D resistivity distribution was also sliced into a five-layer depth to examine the near surface at close range. The 2D results reveal a depth of 50 m across each traverse. Resistivity values generally vary from 1074 Ωm to 3418 Ωm across the study area. Three resistivity structures are delineated which all indicate sand with resistivity values varying from 1074 Ωm to 1998 Ωm, 2009 Ωm to 2915 Ωm, and 3009 Ωm to 3418 Ωm. The 3D depth slice into five layers; 0–5 m, 5–10.8 m, 10.8–17.4 m, 17.4–25 m, and 25.0–33.7 m, having corresponding resistivity values that vary from 659 to 8417 Ωm, 1246 Ωm to 8417 Ωm, 1246 Ωm to 4452 Ωm, 1246 Ωm to 4452 Ωm, and 1246 Ωm to 2355 Ωm. The 3D resistivity distribution shows resistivity values ranging from 1119 Ωm to 3381 Ωm and a maximum depth of 39.6 m. These results reveal that the entire study area is highly vulnerable to erosion as sedimentary subsoil with ERI cutoff above 50 Wm are classified as highly erodible soil. This is thus responsible for the persistence erosion in the entire study area and the occurrence is suspected to be more acute as the depth of scours could impact as deep as 40 m into the subsurface which, in turn, will further expose infrastructures such as bridges, abutments, road pavements, pylons, and other critical amenities in the community to collapse due to scouring. Detailed geotechnical testing is immediately recommended to prioritize critical infrastructures in the area for salvaging before comprehensive erosion control program.

Keywords: Erosion, resistivity, road infrastructures, scouring, wenner array

INTRODUCTION

The erosion rate or erodibility of soil depends on many soil characteristics including plasticity, water content, grain size, percent clay, compaction, and shear strength. Many of these characteristics also influence soil in situ bulk electrical resistivity (ER) measurements.[1]

Soil erosion is a geomorphological process which results in the gradual or quick removal of the surface layer of weathered rock or sediments by agents of denudation and the subsequent transportation to another depositional environment.[2] There are four types of erosion resulting from rainfall: Splash, sheet, rill, and gully erosion. Splash erosion which is generally seen as the first but least severe stage in the soil erosion process is followed by sheet erosion, then rills erosion and finally gullies erosion being the most severe of the four.[3,4] Soil erosion is commonly caused by climatic factors such as wind, storm, temperature, and precipitation. Water (rainfall) and wind are responsible for over 80% of the natural causes of erosion.[5] Given similar vegetation and ecosystems, therefore, areas with high-intensity precipitation, more frequent rainfall, more wind, or more storms are expected to have more erosion. While on the other hand, incessant cultivation of land on steep slopes, mechanized agriculture, deforestation, roads, anthropogenic climate change, and urban sprawl are among the most significant human activities stimulating erosion.[6] Furthermore, the tillage of agricultural lands which breaks up soil into finer particles increases wind erosion rates because the smaller particles are easily picked up by the wind. For the fact that most of the trees are mainly removed from agricultural fields, winds travel at higher speeds in such an open area.[7]

Erosion is also caused by geological factors such as sediment rock type and its porosity and permeability. The composition, moisture, and compaction of soil are all major factors in determining the erosivity of rainfall. Sediments containing more clay tend to be more resistant to erosion than those with sand or silt, because the clay helps bind soil particles together.[8] The topography of the land also determines the velocity at which surface runoff will flow, which, in turn, determines the erosivity of the runoff. Geologic factors generally determine topography while climatic factors modify the efficiency of the erosional processes. Areas that are susceptible to extreme gully erosion processes, therefore, owe their vulnerability to a combination of distinct geological, geomorphological, and pedological characteristics.[9,10]

Methods to directly measure erosion rates are expensive and time consuming,[11] therefore, causes of erosion are better studied and erosion prone areas highlighted for precautionary and remediation actions. Since it is established that geologic factor plays crucial role in geomorphology of an area; then, the use of geophysical and geotechnical methods in the evaluation of geologic processes of an area, therefore, comes to play.[12] Near-surface site characterization using geophysical methods yields important information related to the soil characteristics and can also provide insight into the processes that control the geomorphic evolution of landscapes.[10,13] ER is an intrinsic soil property that indicates a material’s ability to oppose the flow of current. ER imaging (ERI) is a near-surface geophysical technique to collect bulk continuous ER measurements with respect to a fixed depth. ERI surveys are rapid compared with laboratory erosion testing. There are several common factors that influence the ER of soil and soil erodibility, including mean particle size, particle size distribution, soil unit weight, and water content.[14-17] ER tomography (ERT), therefore, is proposed a method to prioritize scour critical infrastructures based on predicted soil erodibility. ERT has become a widely used geophysical method in fields such as geology, environmental science, geotechnical engineering, and archeology.[18-23] ERT could be used as a method to rapidly identify critical infrastructures such bridges and abutments with high erosion potential and prioritize scour critical infrastructure monitoring. Furthermore, vertical electrical sounding has also been used in the evaluation of erosion sites.[10,24] However, for a thorough evaluation of an erosion site; geophysical technique alone may give a limited evaluation. Integrated approach has always been used in some geoenvironmental studies.[25,26]

The study area, Mela Road, Uselu, Egor Local Government Area of Edo State, has been plagued with persistent erosional episodes over the years. The problem has been severe and resulted in scouring of critical road infrastructures such as bridges, road pavements, abutments electric poles, and pylons that traversed the town. Scour, or more generally, erosion, occurs when hydraulic forces exerted by flowing water exceed the resistive forces at the soil surface. The hydraulic forces primarily include the shear forces of the flowing water acting parallel to the sediment plane. The resistive forces within the soil include gravity, friction, cohesion, and adhesion, depending on the type of soil.[16] The threshold of applied hydraulic shear stress at which erosion initiates is the critical shear stress.[27-31] Scour is the number one threat to bridge safety. Scour accounts for 60% of bridge failures, while earthquakes cause only 2% of bridge failures.[32] In this study, therefore, 2D and 3D ERI were carried out to assess the erodibility of the subsoil in the study area with view to providing a mitigation measure.

METHODOLOGY

Location and Geology

The study area, Edo State, South-South Nigeria, falls within the Niger Delta Basin. The basin is an extensive continental margin basin situated in the Gulf of Guinea built out into the Central South Atlantic Ocean at the mouths of the Niger-Benue and Cross River systems during the Eocene [Figure 1]. It is a wave dominated and tidally influenced delta with sand bodies whose thickness may be influenced by growth faulting. The sedimentary rock contains about 90% of sand stone and shale intercalations.[33,34] Edo State is situated in Southwestern part of Nigeria. It is an important sedimentary basin in Nigeria due to the closeness to the oil fields within the Niger-Delta region.

thumblarge

Figure :1 Location map the study area[34]

Mela Road is located adjacent to Uselu market in Egor Local Government Area of Edo State, South-South Nigeria. It lies between latitudes 6°22’19” S and 6°22’36” S and longitudes 5°36’26” W and 5°36’50” W [Figure 2].

thumblarge

Figure :2 Base of the study area

Data Acquisition

Ten traverses were occupied. Wenner electrode array configuration was used and the sets of data were acquired in grid formats [Figure 2]. This electrode configuration was suited for constant separation data acquisition so that many data points can be recorded simultaneously for each current injection. Measurements were made at sequences of electrodes at 10, 20, 30, 40, 50, and 60 m interval using four electrodes spaced at 10 m apart with intertransverse spacing of 50 m from each other with a maximum length of 200 m each.

Data Processing

DIPROFWIN software was used for the inversion of the 2D apparent resistivity data. The field data pseudosection and the 2D resistivity structure were produced after running the inversion of the raw data to filter out noise. RES3DINV and EarthImager3D software were used for the inversion of the 3D apparent resistivity data. The inverted 2D files were collated into a single 3D data set using a batch file and consequently developed to obtain depth slice for the location and the 3D block visualization of ERT imaging for the study area.

RESULTS AND DISCUSSION

2D ERI

Figures 3 and 4 present the 2D resistivity structures along traverse 1–8 and traverse 9–10, respectively. The horizontal distance of 200 m was covered and a depth of 50 m was imaged across each of the 10 traverses. Resistivity values vary from 1074 Ωm to 3418 Ωm in the entire study area. Three resistivity structures are delineated which denote sand with resistivity values that range from 1074 Ωm to 1998 Ωm, 2009 Ωm to 2915 Ωm, and 3009 Ωm to 3418 Ωm [Figure 3]. The ERI sections reveal that two adjacent resistivity sections are similar in resistivity motif indicating localization of resistivity structures across the study area [Figure 3]. The study area is characterized by high resistivity. This may not be unconnected with the fact that many soil characteristics; plasticity, water content, grain size, percent clay, compaction, and shear strength that affect soil erosion also influence in situ bulk soil ER. As such, soils with ER over 50 Wm had 87% probability of classifying as highly erodible.[35] This obviously explains why there are persistent erosional and scoring episodes across the study area. In addition, when the near surface which is mostly impacted by the erosion is characterized by high resistivity values as it is across the study area, it implies that the near surface is porous, the pores are then filled with air and air is infinitely resistive, thus the reason for the high resistivity values recorded near surface. This porous nature, therefore, hastens scoring when erosion takes place across the study area.

thumblarge

Figure :3 2D electrical resistivity imaging sections along traverse 1–8

thumblarge

Figure :4 2D electrical resistivity imaging sections along traverse 9–10

Horizontal Depth Slice

Figure 5 shows the 3D horizontal depth slice into five layers across the entire study area. The five layers are 0–5 m, 5–10.8 m, 10.8–17.4 m, 17.4–25 m, and 25.0–33.7 m, having corresponding resistivity values that vary from 659 Ωm to 8417 Ωm, 1246 Ωm to 8417 Ωm, 1246 Ωm to 4452 Ωm, 1246 Ωm to 4452 Ωm, and 1246 Ωm to 2355 Ωm, respectively. The slices reveal high resistivity values characterizing the subsurface. The depth of erosional impact could be as deep as 11 m from these data, because at 10.8 m, the resistivity value is 8417 Ωm because of reasons earlier discuss [Figure 5]. At deeper depths across the study area, the resistivity value is about half of the resistivity value near surface, implying that the erosional impact my decrease with depth.

thumblarge

Figure :5 Horizontal depth slices obtained from the 3D inversion of square 2D profiles

3D ER Modeling

The 3D resistivity block of the study area is presented in Figure 6. Resistivity values vary from 1119 Ωm to 3381 Ωm and a depth of 39.6 m is imaged. The erosional and scouring impact is likely to intense and deep along the Y-axis of the 3D block compared to other axes of the resistivity block [Figure 6]. The whole 3D resistivity visualization of the entire study area reveals that the whole is prone to intense erosional and its attendant scouring effect may not be unavoidable.

thumblarge

Figure :6 3D resistivity distribution

CONCLUSION AND RECOMMENDATION

Erosion has been a recurrent problem in Uselu community, Mela Road, Egor Local Government Area, South-South Nigeria. Erodibility assessment of the subsurface in the study area using 2D and 3D resistivity investigation was carried out to determine the vulnerability and provide a mitigation measure.

The results reveal that the study area is underlain by sand and characterized by high resistivity values that are far above the minimum resistivity cutoff of 50 Wm for soils that are less erodible. Soils with resistivity values above this cutoff values are largely erodible and vulnerable to erosion. In the study area, the resistivity values vary from 1074 Ωm to 3418 Ωm from the 2D, 659 Ωm to 8417 Ωm from the depth slice, and 1119 Ωm to 3381 Ωm from the 3D resistivity distributions with corresponding maximum depths of 50, 33.7, and 39.6 m, respectively.

The results have shown that the entire study area is highly vulnerable to erosional episodes whose depth of impact may be deep and up to 40 m. This obviously explains the recurrent scouring of critical road infrastructures in the area.

Detailed geotechnical testing is immediately recommended to prioritize critical infrastructures in the area for salvaging before comprehensive erosion control program.

ACKNOWLEDGMENTS

The authors wish to appreciate the Department of Geosciences, University of Lagos, Nigeria, for making available the equipment and workforce used in this research. Special thanks also go to the Ministry of Environment, Edo State, Nigeria, for the early permission granted to assess the location. The authors also appreciate the contribution of the Director of Works, Egor Local Government Area for providing extra security in the location.

REFERENCES

1.  Karim MZ, Tucker-Kulesza SE. Predicting soil erodibility using electrical resistivity tomography. J Geotech Geoenviron Eng 2018;144:04018012.

2.  Egboka BC. Erosion, Its Causes and Remedies. A Key Note Address on Erosion Control and Sustainable Environment. Nsukka, Nigeria:University of Nigeria;2000.

3.  Zachar D. Classification of soil erosion. In:Soil Erosion. Vol. 10. Amsterdam:Elsevier;1982. 48.

4.  Toy TJ, Forster GR, Renard KG. Soil Erosion:Processes, Predicition, Measurement, and Control. New York:John Wiley and Sons;2002. 338.

5.  Blanco H, Lal R. Principles of Soil Conservation and Management. Berlin:Springer;2010. 641.

6.  Julien PY. Erosion and Sedimentation. Cambridge:Cambridge University Press;2010. 1.

7.  Whitford WG. Wind and water processes. In:Ecology of Desert Systems. Cambridge:Academic Press;2002. 65.

8.  Nichols G. Sedimentology and Stratigraphy. New York:John Wiley &Sons;2009. 93.

9.  Ogbonna JU, Alozie M, Nkemdirim V, Eze MU. GIS analysis for mapping gully erosion impacts on the geo-formation of the Old Imo State, Nigeria. ABSU J Environ Sci Technol 2011;1:48-61.

10.  John UJ, Igboekwe MU, Amos-Uhegbu C. Geophysical evaluation of erosion sites in some parts of Abia state, Southeastern Nigeria. Phys Sci Int J 2015;6:66-81.

11.  Hurst MD, Mudd SM, Walcott R, Attal M, Yoo K. Using hilltop curvature to derive the spatial distribution of erosion rates. J Geophys Res 2012;117. DOI:10.1029/2011JF002057.

12.  Uhegbu CA, John UJ. Geophysical and geotechnical evaluation of erosion sites in Ebem-Ohafia area of Abia state, Southern Nigeria. Adv Res 2017;10:1-14.

13.  Santamarina JC, Rinaldi VA, Fratta D, Klein KA, Wang YH, Cho GC, et al. Survey of elastic and electromagnetic properties of near surface soils. In:Near Surface Geophysics. Investigation in Geophysics No. 13;2005.

14.  Abu-Hassanein Z, Benson C, Blotz L. Electrical resistivity of compacted clays. J Geotech Eng 1996;5:397-406.

15.  Kibria G, Hossain MS. Investigation of geotechnical parameters affecting electrical resistivity of compacted clays. J Geotech Geoenviron Eng 2012;10:1520-9.

16.  Grabowski RC, Droppo IG, Wharton G. Erodibility of cohesive sediment:The importance of sediment properties. Earth Sci Rev 2011;105:101-20.

17.  Karim MZ, Tucker-Kulesza SE. Two dimensional soil erosion profile using electrical resistivity surveys. In:Geotechnical Frontiers 2017. Reston, VA:ASCE;2017.

18.  Loke MH. Electrical Imaging Surveys for Environmental and Engineering Studies 1999;2017. Available from:http://www.moho.ess.ucla.edu/?pdavis/ess135_2013/literature/%20lokedcresistivity.pdf. [Last accessed on 2017 Feb 22].

19.  Dahlin T. The development of DC resistivity imaging techniques. Comput Geosci 2001;27:1019-29.

20.  Vaudelet P. Mapping of contaminant plumes with geoelectrical methods. A case study in urban context. J Appl Geophys 2011;75:738-51.

21.  Hossain MS, Khan MS, Hossain J, Kibria G, Taufiq T. Evaluation of unknown foundation depth using different NDT methods. J Geotech Geoenviron Eng 2011;27:209-14.

22.  Chambers, JE. River terrace sand and gravel deposit reserve estimation using three-dimensional electrical resistivity tomography for bedrock surface detection. J Appl Geophys 2013;93:25-32.

23.  Snapp M, Tucker-Kulesza S, Koehn W. Electrical resisitivity of mechancially stablized earth wall backfill. J Appl Geophys 2017;141:98-106.

24.  Igboekwe MU, Eke AB, Adama JC, Ihekweaba G. The use of vertical electrical sounding (VES) in the evaluation of erosion in Abia state University, Uturu and Environs. Pac J Sci Technol 2012;13:509-20.

25.  Ajayi O, Olorunfemi MO, Ojo JS, Adegoke CW, Chikwendu KK, Oladapo MI, et al. Integrated geophysical and geotechnical investigation of a dam site of River Mayo Ini, Adamawa state, Northern Nigeria. Afr Geosci Rev 2005;12:179-88.

26.  Choudhury K, Saha DK. Integrated geophysical and chemical study of saline water intrusion. Groundwater 2004;42:671-7.

27.  Partheniades E. Erosion and deposition of cohesive soils. J Hydraul Div 1965;91:105-39.

28.  Ariathurai CR. A Finite Element Model for Sediment Transport in Estuaries, Ph.D. Thesis. Berkley, CA:University of California;1974.

29.  Hanson GJ, Cook KR, Simon A. Determining erosion resistance of cohesive materials. In:Proceedings of ASCE International Water Resources Engineering Conference. Reston, VA:ASCE;1999.

30.  Utley BC, Wynn TM. Cohesive soil erosion:Theory and practice. In:World Environmental and Water Resources Congress. Reston, VA:ASCE;2008. 1-10.

31.  Bernhardt M. Mississippi river levee failure:June 2008 flood. Int J Geoeng Case Hist 2011;2:127-62.

32.  Shirole AM, Holt RC. Planning for a comprehensive bridge safety assurance program. Transp Res Rec 1991;1290:39-50.

33.  Alile OM, Ujuanbi O, Evbuomwan IA. Geoelectric investigation of groundwater in obaretin-Iyanomon locality, Edo state, Nigeria. J Geol Min Res 2011;3:13-20.

34.  Ministry of Lands and Survey, Benin City;2009.

35.  Karima MZ, Tucker-Kuleszaa SE, Bernhardt-Barry M. Electrical resistivity as a binary classifier for bridge scour evaluation. Transp Geotech 2019;19:146-57.