large

An assessment of the vertical movement of heavy metals in the soils of Mpape Dumpsite, Federal Capital Territory, Abuja, Nigeria

J. Y. Magaji*, I. I. Y. Mallo

Department of Geography and Environmental Management, University of Abuja, Nigeria

Address for correspondence: J. Y. Magaji, Department of Geography and Environmental Management, University of Abuja, Nigeria. E-mail: john.magaji@uniabuja.edu.ng
Submitted: 02-07-2020, Accepted: 20-07-2020, Published: 30-07-2020

ABSTRACT

The study aimed at assessing the vertical movement of heavy metals in the soils of Mpape dumpsite. It is an experimental research design, where soil samples for the study were sourced from the dumpsite. The dumpsite was demarcated into six transects, out of which three were randomly selected for this study. A sampling point was marked along the midpoint of each transect. At each point, a profile pit of 2 m by 2 m and a depth of 2 m were dug at each sample point. The soil profiles depth was divided into six equal parts of 30 cm intervals and samples were collected at each interval. A total of 18 soil samples were collected for the study. Soil samples collected were bagged in black polythene, labeled accordantly, and taken to Abuja Environmental Protection Board Laboratory for analysis. The following heavy metals were investigated in the soil samples: Lead, mercury, copper, cadmium, cyanide, manganese, chromium, iron, and soil pH. The methods and procedures for the analysis were adopted after Ademoriti (1996) and APHA (2000). The results show that there is a progressive decrease in the concentration of heavy metal with depth except in some exceptional cases. Copper decreases with depth with a little rise within 91 cm to 120 cm. Cyanide and iron increase with depth to 120 cm and then started decreasing with depth. Lead increases with depth to 120 cm and then started decreasing, likewise manganese, but mercury decreases with depth to 120 cm and then start rising with depth. To further verify the level of significance of variation of the heavy metals in the soils, the result was further subjected to analysis of variance (ANOVA). Result implies that there is no significant variation in the concentration of the heavy metals within and between samples. The implication of this result is that for a good quality groundwater around the study area, it has to be dug to a reasonable depth. It is therefore recommended that studies on the factors and rate of heavy metals mobility in the soils are to be conducted.

Keywords: Dumpsite, heavy metal, mobility, Mpape, soil profile, vertical


INTRODUCTION

The environment is continually being degraded in many ways, including through leaching taking place in waste dumpsites. The leachates composed of metals and variety of pollutants. Heavy Metals are defined as elements in the periodic table having an atomic number more than 20 or densities more than 5 g/cm3 generally, excluding alkali metals and alkaline earth metals. These metals are all naturally occurring substances which are often present in the environment at low concentrations. They are persistent environmental contaminants because they are not degradable and enter the body through food, air, and water and bioaccumulate over a period of time to cause health problems.[1,2] They are sometimes found in the soil and water as a result of anthropogenic activities such as mining, smelting, domestic waste, and various industrial activities. Heavy metals are being released into the environment in the form of waste from these anthropological activities to meet the everyday demand for life.[3]

The mobility of these metals most likely occurs where there is the high disposal of sewage sludge made on sandy soils that are acidic with low organic matter and receiving high rainfall or irrigation water. It is common practice in Nigeria and some other developing countries for people to grow their crops on waste dumps and on soils where raw sewage is discharged.[4,5] The effect of the presence of some of these metals in such areas is their uptakes by plants are grown in such areas as a result of the soil fertility.

Some heavy metals have been reportedly added to the soil through farmyard and chemical fertilizer application. Heavy metal emissions from other sources, such as worn automobile tires and brake linings, roofs, and food remnants in residences, as well as other domestic by-products, such as refuse, have also been identified.[6,7] Heavy metals emanating from anthropogenic sources are more dangerous because of their instability and solubility, which leads to high bioavailability. The adverse effects of refuse dumpsites to the soil and air quality are well documented.[8]

Several researchers have been carried out on heavy metals by scholars such as metals in street dust and agricultural soils.[9-12] Heavy metal toxicity is determined by route, pattern, and duration of exposure. Routes of exposure to heavy metals include (i) ingestion of soils, contaminated water, vegetables and fruits grown on contaminated soils, and animals that grazed on contaminated areas; (ii) inhalation of soil particles, dust, and fumes, and (iii) dermal contact.[13,14] Drinking of contaminated water and consumption of agricultural products are the major represents an important source of heavy metals ingestion.

At present, there is no official policy to stop these practices or sensitize the masses on the dangerous implications of these practices. Leachability and uptake of heavy metals by plants are soil and plant specific. While leafy, for instance, vegetables exhibit preferential uptake of cadmium and copper, cigarette leaves can accumulate large amounts of arsenic and cadmium, arsenic, and lead. Elevated levels of arsenic (0.5–7.5 mg/kg) have been found in rice and vegetables grown in Chenzhou City of Southern China.[15] Several health hazards have been associated with the consumption of high doses of heavy metals. These health hazards range from mild illnesses such as ulcers, diarrhea, nausea, abdominal pain, gastrointestinal disorders, respiratory disorders, cough, nervous disorder, and psychological disturbances to life-threatening diseases such as cancers, cardiovascular diseases, asthma, kidney and liver damage, coma, and diabetes.

The vertical mobility of metals is aided by either force of gravity or capillary rise. Vertical mobility of metals and pollutants in the soils can affects the quality of soils and water. Heavy metal transfer in soil profiles is a major environmental concern because even slow transport through the soil may eventually lead to deterioration of groundwater quality. The risks of heavy metal pollution of groundwater are determined by the mobility and availability of elements. The ability to predict the mobility of heavy metals in the soil and the potential contamination of groundwater supplies is a prerequisite in any program aimed at protecting groundwater quality.[16,17]

In light of the aforementioned realities, the need for a detailed study of the movement of heavy metal contamination in the soils of the dumpsite with a view to ascertain the extent of soil contamination and its associated effects on groundwater cannot be overemphasized.

FIELD AND LABORATORY METHODS

The Mpape dumpsite was the major site used as a landfill for the Federal Capital Territory (FCT) before relocating to Gosa, around 2006, when the site was filled up. It is located at the Northeastern edge of the Gwagwa Plains, along Aso-Bwari Hills by the Kubwa expressway near the tipper garage of Mpape, within the watershed of the River Usuma Basin. The FCT Abuja is located between latitudes 8° 25’ and 9° 25’ north of the equator and longitudes 6°45’ and 7°45’ east of Greenwich Meridian [Figure 1].

thumblarge

Figure 1: Location of Mpape Dumpsite in the Federal Capital Territory, Nigeria. Source: Adapted and modified from diverse sources by the author (2018)

It occupies an area approximately 8000 km2 and occupies about 0.87% of Nigeria. The territory is situated within the region generally referred to as the Middle Belt and is bordered on all sides by four states, namely Kogi, Niger, Kaduna, and Nasarawa.

The Federal Capital consists of a number of distinct physiographic regions, basically of two types, the hills, and the plains. The elevations of these hills range from about 100 m to about 300 m in the more rugged areas. The landfill is situated at the upper part of the plains. The influence of parent materials on the soil of FCT stem from the fact that two-parent materials, namely, crystalline rocks of the basement complex and Nupe sandstone, are the surface from which they are formed. The major soil type of the FCT is tropical ferruginous. The alluvial complexes of the territory are contained in all the stream channels which are made up of gleysols which are very fertile and occur dominantly in Abaji Area Council of the FCT. The soils of the plains are mostly sandy and sandy-loam.

The FCT records the highest temperature during the dry season months, which are generally cloudless. The maximum temperature occurs in the month of March, with amounts varying from 37°C in the Southwest to about 30°C in the Northeast. This also coincides with the period of high diurnal ranges of temperature which can drop to as low as 17°C, and by August, diurnal temperature rarely exceeds 7°C.

The dumpsite was demarcated into six transects, out of which three were randomly selected for this study. A sampling point was marked along the midpoint of each transect. At each point, a profile pit of 2 m by 2 m and at a depth 2 m were dug [Table 1].

Table 1: Sampling frame

thumblarge

The soil profiles have no distinct strata; as such, the profile depth was divided into six at 30 cm intervals and samples were collected at each interval. A total of 18 soil samples were collected within the dumpsite. Soil samples collected were bagged in black polythene, labeled, and taken to Abuja Environmental Protection Board Laboratory for analysis. The following parameters were investigated in the soil samples: Soil pH, lead, mercury, copper, cadmium, cyanide, manganese, chromium, and iron.

The concentration of these metals present in any type of water may satisfactorily be determined by atomic absorption spectroscopy or colorimetric methods. These two methods are rapid and do not require extensive separation techniques. Metals are readily form complex ions with organic constituents of water such as wastewater or effluent.[18] The methods and procedures for the analysis were adopted from Table 2.[19]

Table 2: Summary of parameters and the equipment used for the analyses

thumblarge

RESULTS AND DISCUSSION

Descriptive Analysis of Results

The results of the descriptive analysis of the occurrences of heavy metals across the soil profiles of the three sample points at different depths are presented in Table 3.

Table 3: Results of the analysis of heavy metals in the soils samples at different depths

thumblarge

Results in Table 3 sample “A” show that the soil’s pH ranges between 6.0 and 7.0, with a mean of 5.1, a standard deviation of 1.24, and a coefficient of variation of 24.4%, indicating moderate variation. The pH value increases with depth. The concentration of cadmium ranged between 3.33 and 3.94, with a mean of 3.77, a standard deviation of 0.27 and coefficient of variation of 7.2%, in sample A and C, indicating a very low variation, while 95.4% in sample C which implies a very high variation in the occurrences of cadmium as it migrates down the profile. The value of cadmium was found to increase with depth except in sample B. The concentration of copper ranged between 0.06 and 0.11, with a mean of 0.35, a standard deviation of 0.52, and a coefficient of variation 7.2%. The coefficient of variation of Cu in sample B is also high and the concentration decreases with depth in sample C; it increases with depth with a very low variation. Cyanide ranges between 3.64 and 3.77, with a mean of 3.69, a standard deviation of 0.05, and low coefficient of variation 1.4%. The coefficient of variation of cyanide in sample B and C is 1.2% and 7.3%, respectively, indicating low variation in the concentration. The concentration decreases with depth in sample A and B except C that increases with depth.

Iron ranges between 0.05 and 2. 49, with a mean of 1.22, a standard deviation of 0.99 and a high coefficient of variation in sample A and B except C that shows low variation. The concentration decreases with depth in sample A and B except C that increases with depth. Lead ranges between 4.0 and 4.24, with a mean of 4.16, a standard deviation of 0.01, and a very low coefficient of variation and decreases in all the three samples. Manganese ranges between 1.20 and 2.49, with a mean of 1.60, a standard deviation of 0.62 and a high coefficient of variation in samples A and B, and a moderate variation in sample C. The concentration decreases in sample A, fluctuates in B, and increases in C with depth. Mercury ranges between 6.09 and 6.31, with a mean of 5.48, a standard deviation of 6.63 and a low coefficient of variation in all samples. The concentration decreases with depth in sample A and fluctuates in B and C.

Variation in the Vertical Concentration of Heavy Metals in the Soil

The soil samples obtained from different sampling points were compared to see whether there is variation in the concentrations of heavy metals with depth. The result of the analyses is presented in Figure 2.

thumblarge

Figure 2: Concentration of heavy metal with depth

The pH values increase as one goes down the profile as the water pH is fairly acidic down the profile. Cadmium increases with depth to 120 cm and then started decreasing. Copper decreases with depth with a little rise within 91 cm–120 cm. Cyanide and iron increase with depth to 120 cm and then started decreasing with depth. Lead increases with depth to 120 cm and then started decreasing, likewise manganese, but mercury decreases with depth to 120 cm and then start rising with depth. To further verify the level of variation of the heavy metal in the soils, the results were further subjected to analysis of variance (ANOVA), as presented in Table 4.

Table 4: Results of analysis of variance (ANOVA)

thumblarge

The results of the analysis show that the F-ratio is 0.111 and F-crit. is 2.438. It shows that the calculated F-value (0.111) is less than the F-critical (2.438). It, therefore, implies that the null hypothesis is accepted, we then conclude that there is no significant difference in the values of the heavy metals with depth.

Correlations between Different Heavy Metals in the Soils

Pearson correlation analysis was determined among heavy metals to provide information on their sources and transport. The results of Pearson correlation analysis in soils at the three sampling points are displayed in Table 5.

Table 5: Pearson correlation coefficient matrix of heavy metals in the soil

thumblarge

Table 5 presents the results of the correlation coefficient for various heavy metals. The results shows that there is a significant positive correlation between pH and Cr, Cr, and CN, Cr and Fe, CN, and Fe at (P ≥ 0.05) with a correlation coefficient of r = 0.82, r = 0.90, r = 0.86, and r = 0.85, respectively. There is also a significant negative correlation between pH and CN, pH, and Fe, and between Cd and Hg at (P ≥ 0.05) with a correlation coefficient of r = -0.86, − 0.79, and −0.87, respectively.

Statistics also show that there is a significant positive correlation between Cu and CN, Cu, and Fe at (P ≤ 0.01) with a correlation coefficient of r = 0.95 and r = 0.93, respectively. There exist also a significant negative correlation between pH and Cu Pb and Hg, at P ≤ 0.01 with a correlation coefficient r = −0.97 and r = −0.89, respectively.

There is a positive but insignificant correlation between pH and Pb, pH and Mn, pH and Hg, Cd and Cu, Cd and Fe, Cd and Pb, Cd and Mn, Cr and Cu, Cr and Pb, Cr and Hg, Cu and Pb, CN and Pb, Fe and Pb, Pb and Mn, and an insignificant negative correlation between pH and Cd, Cr and Cd, CN and Cd, Cr and Mn, Cu and Mn, Cu and Hg, CN and Mn, CN and Hg, Fe and Mn, Fe and Hg, and Mn and Hg. Recall that the positive correlation implies that an increase in one metal would results to an increase in the other metal and vice versa. Furthermore, a negative correlation signifies that their sources are quite different. Correlation studies, therefore, help in the understanding of the chemistry of heavy metals in soils and their association.

DISCUSSION OF RESULTS

Landfills are supposed to include expensive and carefully constructed impermeable layers, which prevent leachate moving downward into the ground and drainage system to bring the leachate to a treatment plant or a storage tank in their designs. In the case of Mpape dumpsite, it was discovered that it did not meet up the criteria. There is uncontrolled leachate as such it actually makes the pollution worse than an open dump because all the leachate is concentrated in one place, giving natural purification systems very little chance of reducing the pollution impact.[20]

One of the major factors influencing the migration and transformation of metals is pH.[21] Any change in the level of pH conditions in the system will have a certain impact on the migration and distribution of heavy metals.[22] The results show that there is a general decrease in the concentration of heavy metals with increasing depth implying that the pH values increase with depth. This agrees with the work of Musa,[23] in his work titled “An evaluation of soil and crop conditions on a waste dump site in Anyigba Kogi state,” where he observed that the soil pH values increase with depth. Increase soil pH is regarded as a major advantage when Municipal Solid Waste (MSW) compost is used. Mkhabela and Warman,[24] in their studies of a Pugwash Sandy Loam Soil in Nova Scotia, also discovered an increase in pH from 6.1 to 7.6, Hernando et al.[25] observed from their work “effect of the application of a municipal refuse compost on the physical and chemical properties of a soil” an increase of pH from 5.8 to 6.4. Maynard[26] observed an increase of 5.9 to 6.3, Zheljazkov and Phil,[27] in their work “Source-Separated MSW Compost Application to Swiss Chard and Basil” observed increase in pH from 4.9 to 5.8. The increase in pH could be as a result of rainwater. Water passing through the soil leaches basic nutrients such as calcium and magnesium from the soil. They are replaced by acidic elements such as aluminum and iron. For this reason, the soil’s pH values increase with depth as more salts moved down the soils.

As earlier observed, the general trend of the mobility of the heavy metals under investigation revealed a decrease of concentration with depth, with few exceptional cases that increase with depth, such as almost all of them Cd that increases from 1.15 mg/L to 1.68 mg/L at the depth between 1 cm and 90 cm, then decreases from 1.66 mg/L to 1.36mg/L. Pb also exhibits an initial increase from 4.63 mg/L to 4.75 mg/L, then decreases from 4.73 mg/L to 4.48 mg/L, between 1 cm to 60 cm and 61 cm to 120 cm, respectively. Mn and Hg also decrease between 1 cm and 60 cm, then increases between 61 cm and 180 cm depth. The increase in the concentration of the heavy metals can be attributed to preferential flow, while the decrease can be attributed to a slow release of the leachates, and due to soil properties such as the soil texture and soil structure. These conditions also brought about variations in the occurrences of the heavy metals in the soils.

Analysis of variance shows that there is no significant variation in the distribution of heavy metals within and between the dumpsite. The correlation between pH and all the heavy metals under study was significant at (p ≥ 0.05) Cd, Hg, and Pb. Yang et al.[28] studied the effect of the change on the speciation of heavy metal Cd, and the result showed that the different speciation of Cd varies with the change of pH and Cd content of carbonate fraction and Fe-Mn oxides fraction increases with pH increasing in the range pH 4.5–9.5.

CONCLUSION AND RECOMMENDATIONS

Almost all the investigated heavy metals show a similar trend of decrease with depth except in some few exceptional cases, with low and insignificant variation within and between samples. Some heavy metals correlated significantly positively/negatively with one another, indicating their similarly sources and or origin. That is a clear demonstration of heavy metals migration in the soils. It is therefore recommended that studies on the factors and rate of heavy metals mobility in the soils. It is also recommended that for groundwater harvesting, very deep wells will be of advantage as far as quality water is a concern. Above all, further location and construction of landfill should follow the recommended guidelines of siting and construction of landfills.

CONFLICTS OF INTEREST

There are no conflicts of interest.

REFERENCES

1. Lozet J, Mathieu C. Dictionary of Soil Science. 2nd ed. Rotterdam:August AiméBalkema;1991.

2. Bambara LT, Kabore K, Cisse O, Derra M, Zougmore F, Bentil N. Assessment of pollution in agricultural soil and interrelationship between the heavy metals at Paspanga, Burkina Faso. J Environ Sci Toxicol Food Technol 2015;9:84-90.

3. World Health Organization. Environment and Health Risks:A Review of the Influence and Effects of Social Inequalities. Europe:World Health Organization;2010. https://www.euro.who.int/data/assets/pdf_file/0003/78069/E93670.pdf?ua=1. [Last accessed on 2019 Nov 12].

4. Khana MU, Malika RN, Muhammad S, Ullah F, Qadird A. Health risk assessment of consumption of heavy metals in market food crops from Sialkot and Gujranwala Districts, Pakistan. Hum Ecol Risk Assess 2015;21:327-37.

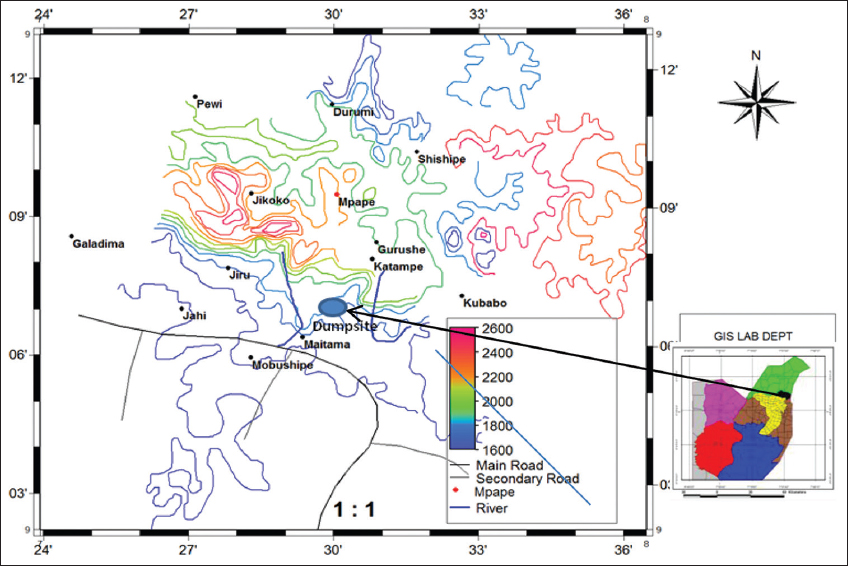
5. Magaji JY. Effects of waste dump on the quality of plants cultivated around Mpape dumpsite FCT Abuja, Nigeria. Ethiop J Environ Stud Manag 2012;5:567-73.

6. Sorme L, Lagerkvist R. Sources of heavy metals in urban wastewater in Stockholm. Sci Total Environ 2002;298:131-45.

7. Magaji JY, Jenkwe, ED. Assessment of the Effects of Spent Engine Oil on Soil Properties and its implication on Plants Growth in Gwagwalada, Abuja, Nigeria. Nigerian Geographical Journal 2017;11:50-66.

8. Elaigwu SE, Ajibola VO, Folaranmi FM. Studies on the impact of municipal waste dumps on surrounding soil and air quality of two cities in Northern Nigeria. J Appl Sci 2007;7:421-5.

9. Mnolawa KB, Likuku AS, Gaboutloeloe GK. Assessment of heavy metals pollution in soils along major roadside areas of Botswana. Afr J Environ Sci Technol 2011;5:186-96.

10. Baba AA, Adekola FA, Lawal A. Trace metals concentration in roadside dust of Ilorin town. Centrepoint (Science Edition) 2009;16:57-64.

11. Salmamanzadeh M, Saeedi M, Nabibidhendi G. Heavy metals pollution in street dusts of Tehran and their ecological risk. J Environ Stud 2012;38:4-6.

12. Wei B, Yang L. A review of heavy metal contamination in urban soils, urban road dust and agricultural soils from China. Michrochem J 2010;94:99-107.

13. Tchounwou PB. Yedjou CG, Patlolla AK, Sutton DJ. Heavy metal toxicity and the environment. Mol Clin Environ Toxicol Exp Suppl 2012;101:133-64.

14. Odai SN, Mensah E, Sipitey D, Ryo S, Awuah E. Heavy metals uptake by vegetables cultivated on urban waste dumpsites:A case study of Kumasi, Ghana. Res J Environ Toxicol 2008;2:92-9.

15. Liao X, Chen T, Xie H, Liu Y. Soil as contamination and its risk assessment in the areas near the industrial districts of Chenzhou city, Southern China. Environ Int 2005;31:791-8.

16. Muhammad S, Iqbal J, Akhter G, Shah MH. Fractionation, bioavailability, contamination and environmental risk of heavy metals in the sediments from a freshwater reservoir, Pakistan. J Geochem Explor 2006;184:199-208.

17. Mahmood A, Malik RN. Human health risk assessment of heavy metals via consumption of contaminated vegetables collected from different irrigation sources in Lahore, Pakistan. Arab J Chem 2014;7:91-9.

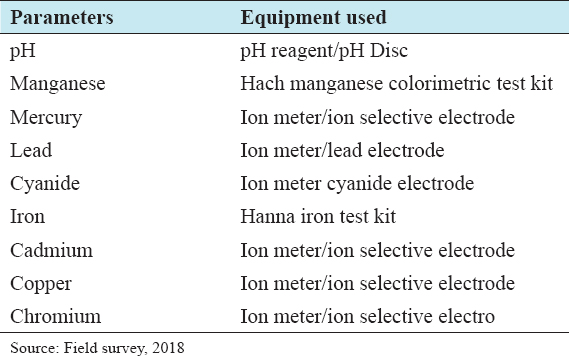
18. Ademoriti CM. Standard Methods for Water and Effluents Analysis. Ibadan:Foludex Press Ltd.;1996.

19. American Public Health Association. System for Analysis of Waste Water. Loveland, Colorado:Hach Company;2000.

20. Magaji JY. Evaluation of Mpape landfill standard in FCT Abuja, Nigeria. Int J Sci Res Publications 2020;10:589-96.

21. Inmaculada R, Angel DT, Forja JM, Abelardo GP. The influence of pH and Salinity on the toxicity of heavy metals in sediment to the estuarine clam Ruditapes philippinarum. Environ Toxicol Chem 2004;23:1100-7.

22. Gabler HE. Mobility of heavy metals as a function of pH of samples from an overbank sediment profile contaminated by mining activities. J Geochem Explor 1997;58:185-94.

23. Musa SD. An Evaluation of Soil and Crop Conditions on a Waste Dump Site in Anyigba Kogi State. A Ph.D Progress Report to the Department of Geography and Environmental Management. Nigeria:University of Abuja;2009.

24. Mkhabela M, Warman PR. The influence of municipal solid waste compost on yield, soil phosphorus availability and uptake by two vegetable crops, grown in a Pugwash sandy loam soil in Nova Scotia. Agric Ecosyst Environ 2005;106:57-67.

25. Hernando S, Lobo MC, Polo A. Effect of the application of municipal refuse compost on the physical and chemical properties of soil. Sci Total Environ 1989;81-82:589-96.

26. Maynard A. Evaluating the suitability of MSW compost as a soil amendment in field-grown tomatoes. J Compost Sci Util 1995;1:34-6.

27. Zheljazkov JV, Phil W. Source-separated municipal solid waste compost application to Swiss chard and basil. J Environ Qual 2004;33:542-52.

28. Yang ZF, Chen Y, Qian X, Guo L, Zhu HY. A study of the effect of soil pH on chemical species of cadmium by simulated experiments. Earth Sci Front 2005;12:252-60.