INTRODUCTION
Infectious diseases are becoming more alarming with high morbidity and mortality in developing countries like Africa.[1] Viral infections like hepatitis B virus (HBV) are often regarded as an incurable and fatal disease.[1] Again, the emergence of drug-resistant strains has compromised the efficacy of most antiviral agents; some have troublesome and unbearable side effects while some are less efficacious.[2,3] Drug repositioning approach might be a better alternative for discovering more effective and less harmful antiviral agents. The high cost of developing drugs has limited the number of antiviral agents into a shortlist.[4]
Viral hepatitis is becoming more alarming with the increasing incidence of chronic viral hepatitis progressing into chronic liver disease and liver cirrhosis. It is estimated that about one-third of the world’s population are living with hepatitis B viral infection.[5] Globally, about 400 million people are living with HBV and its the tenth leading cause of death.[5] Twenty-three million Nigerians are currently living with HBV while about 20 million Nigerians are living with both hepatitis C and B viruses.[6] The prevalence of hepatitis B and C in Africa is 10–20% and 6%, respectively.[7] Fewer agents such as interferon, lamivudine, and ribavirin are available for the treatment. These drugs have a spectrum of intolerable side effects and low efficacy.[7]
Several scientists have attempted to reposition approved drugs for the treatment of HBV. For instance, Van de Klundert et al.[8] evaluated 640 food and drug administration (FDA)-approved drug for their ability to inhibit HBV transcription in HepG2 transfected cells. Terbinafine, a squalene epoxidase antifungal agent, was found to potently suppress HBx-mediated HBV RNA transcription.
The aim of the study was to identify two promising generic drugs and conduct an antiviral drug combination studies against HBV.
The objectives of the study include:
-
To develop a local database for FDA-approved drugs and three HBV viral protein targets
-
To screen commercially approved drugs using structural-and ligand-based pharmacophores as templates
-
To run a docking simulation of the selected drugs against the three viral targets and select best two
-
To run an in vitro antiviral drug combination studies of the two selected drugs against HBV-infected HepG2 cell line.
MATERIALS AND METHODS
Criteria for Viral Targets Selection
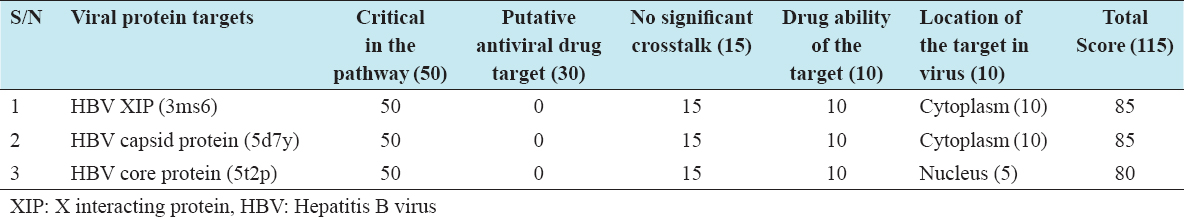
The HBV viral targets were selected based on validated selection criteria and scoring.[9] The criteria include: Involvement in a critical pathway necessary for the survival and replication of the viruses, confirmed or putative targets of known antiviral agents, absence of significant cross-talk from the National Center for Biotechnology Information blast search, drugability of the target (easily accessible binding site), and site or location of the protein target within virus; either on the cell surface/cytoplasm or inside the nucleus.[9] Targets with a score of at least 80 out of 115 were selected and considered as critical in the survival and multiplication of the viruses.[10]
Development of Local Database of Viral Protein Targets from Protein Data Bank (PDB)
PDB is an archive of three dimension (3D) structures of about 35,000–50,000 biological molecules. Three HBV viral targets (in PDB text format) necessary for their survival and multiplication were selected and downloaded from the PDB website (www.rcsb.org) and saved in PDB text format. A local database was created for the viral targets in my personal computer.[11]
Development of Local Database for FDA-approved Drug from DrugBank
A DrugBank is a drug database that contains more than 4000 compounds linked to about 14,000 molecular targets. All (1491) FDA-approved drugs were downloaded from DrugBank website (www.drugbank.ca) and saved in structural data format.[12]
Structure-based Pharmacophore Screening
Ligandscout advanced molecular design software was used to generate structure-based pharmacophore for each viral targets using the target cocrystallized ligand complex as a template.[9]
Ligand-based Pharmacophore Screening
Ligand-based pharmacophore was generated using all the cocrystallized ligands for the nine different viral targets as templates. The generated ligand-based pharmacophore can be merged or shared similarity pharmacophore.[9]
Screening of FDA-approved Drugs using the Structural and Ligand-based Pharmacophores as Templates
The structure and ligand-based pharmacophores were copied to the screening perspective using the copy board widget. Approved drugs downloaded from the DrugBank were loaded to the screening database using the “create and load screening database.” The generated pharmacophores were screened against the approved drugs and the drugs with similar pharmacophores were displayed in the tabular form compatible with excel.[13]
Docking Simulation of the Selected Drugs from Pharmacophore Screening against Three HBV Viral Targets using PyRx Virtual Screening Tool
Importation of macromolecules from the local database
To import macromolecule from the local database, file > import molecule was selected, this displays “import molecule wizard” carrying different options. Workspace tarball > local file was then selected and “next” button clicked followed by finish button. Shortly an “import completed successfully” dialog appears, then OK button was clicked. The 3D structure of the macromolecule was displayed in the workspace, and the protein ID appears in the “molecule tab” of the navigator panel. Atoms of the macromolecule were viewed in the workspace by deselecting and selecting them in the “molecule tab” of the navigator panel. The macromolecule was inspected in the workspace by right-clicking and holding the mouse. The binding site of the cocrystallized area examined, in shape, size, polarity, and accessibility.[13]
Importation of ligands from the local database
To import ligands from the local database, select open babel button in the control panel of the PyRx tool. Clicking the insert new item tab on the upper left-hand corner of the open babel panel, a “choose open babel supported file” box appears that take you to the ligand database in my personal computer. The ligand of interest was then selected and imported into the PyRx. The selected ligands appear in the open babel results table displaying the drugs ID, formula, weight, and LogP. Minimized atomic coordinates of the ligand were created using “the minimize all” widget. The minimized coordinate of the ligands right-clicked and different options displayed. The option “covert all to AutoDock ligand PDBQT” was selected. The PDPQT format of the ligand appears in the ligand compartment of the AutoDock navigator area.[13]
Running the molecular docking simulation
The ligands of interest were selected from the AutoDock widget and “select ligand” button pressed, followed by the forward button. This automatically inputs the ligands into the ligand list in the control panel of PyRx software. Again, the macromolecules were selected from the AutoDock widget, and “select macromolecule” button pressed followed by the forward button, and this automatically inputs macromolecules into the macromolecule list in the control panel.[14]
To run Vina, the “run Vina” was clicked, then forward button pressed. Finally, “analyze result” was selected then forward button. This displays the binding affinities of the various poses against the ligands. The lower the binding affinities, the better the protein-ligand interaction since molecules interact to conserve energy.[14]
The analyze results page is where the final docking results were presented. The table was sorted according to the values of the binding energies. The table row was selected one by one to see the corresponding docking pose for each ligand-protein complex in the 3D scene. The numerical results were exported as comma-separated values file compatible with Excel.[14]
Selection of the Best Two (2) Performing Drugs for In vitro Antiviral Studies
Two drugs with overall best binding affinities against the three viral targets were selected for confirmation of activity in the wet laboratory using in vitro cell line-based assay. The analytical grade of the selected drugs was purchased from Sigma-Aldrich.
In vitro Model for HBV
Ten thousand cells/well were cultured in 24-well plates for 24 h to achieve 80–90% confluency. Media changed and the cells washed with phosphate buffer solution before the addition of viral particles.
-
For HepG2 cells, l ml of serum infected with HBV (containing 4.7 Log IU/ml of virus) was added to each well.
The infected cells were maintained and propagated in Dulbecco’s modified eagle medium supplemented with 10% fetal bovine serum and 1% penicillin/streptomycin and incubated at 37°C in a humidified and 5% CO2 chamber.[15]
In vitro Antiviral Drug Combination Studies of the Two Selected Drugs
Twenty-four hour post-infection, the HBV infected cell lines were treated with three graded concentrations of the two selected drugs – in combination, dimethyl sulfoxide (DMSO) treated and lamivudine (in duplicates). The viral DNA was released following lyses of the infected cell lines at 48 h post-treatment. The viral loads for each of the treatment groups were quantified using real-time polymerase chain reaction.
Determination of Percentage Viral Inhibition (%VI)
The %VI for each of tested group was calculated using the formula[16]:
Where VC is the viral load of the DMSO-treated group
VTG is the viral load of the treated group.
Determination of Half-maximal Inhibitory Concentration (IC50)
Nonlinear regression analysis curve generated by GraphPad Prism was used to extrapolate the IC50 of each drug against each virus. The IC50 is the concentration that produces 50% VI.[17]
Determination of Half-maximal Toxic Concentrations (CC50)
Nonlinear regression analysis curve generated by GraphPad Prism was used to extrapolate the CC50 of each drug against each cell line. The CC50 is the concentration that produces 50% cell line viability.[17]
Determination of Selectivity Index (SI)
The SI for each drug against a particular cell line was calculated using the formula.[17]
Determination of the Combination Index (CI) and Dose Reduction Index (DRI)
Compusyn combination software was used to generate the CI and DRI. The (CI) <1 is synergism, CI >1 is antagonism while CI = 1 is additivism. The DRI >1 is favorable, DRI <1 is unfavorable, and DRI = 1 is no dose reduction.[18]
Data Analysis
Data were presented in tables and graphs and were expressed as mean ± SEM. The IC50 and CC50 were extrapolated from a sigmoidal dose-response curve. Statistical differences between the viral loads for the different drug groups and distinct post-treatment time points were analyzed using a two-way ANOVA followed by Dunnett’s multiple comparison tests. P < 0.05 was considered to be statistically significant. All analyses were performed using GraphPad Prism version 7.
RESULTS AND DISCUSSION
Results
Three selected protein targets and their scores
Nine viral protein targets were identified and validated. The total score for each viral target was >80, hence validated [Table 1].
Table 1: List of the three selected protein targets and their scores
Selected drugs from structure-and ligand-based pharmacophore
Three hundred and eight (400) FDA drugs and forty-three (40) drugs were selected from the structure- and ligand-based pharmacophore screening.
Best two drugs and there binding affinities
Iodixanol and sirolimus had the best binding affinities against the three HBV targets. The binding affinities for each drug against the viral targets were greater than that for the respective cocrystallized ligands [Table 2].
Table 2: List of best two drugs and their binding affinities
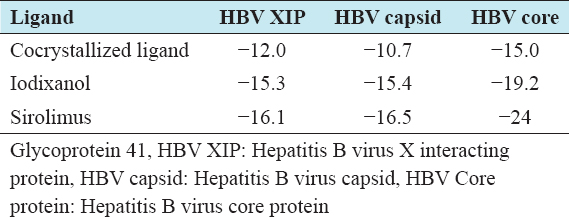
Iodixanol and sirolimus (ball and stick) superimpose with the cocrystallized ligands (cartoon shape) and fit into the binding poses [Figures 1-6].
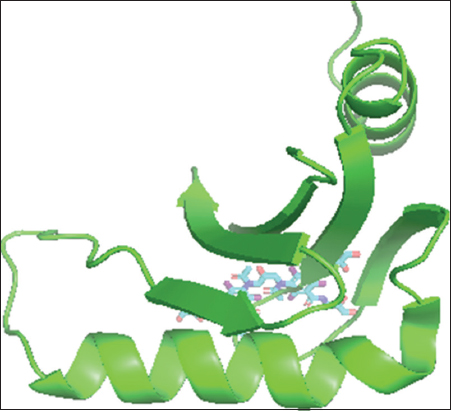
Figure 1: Iodixanol-Hepatitis B virus X interacting protein complex
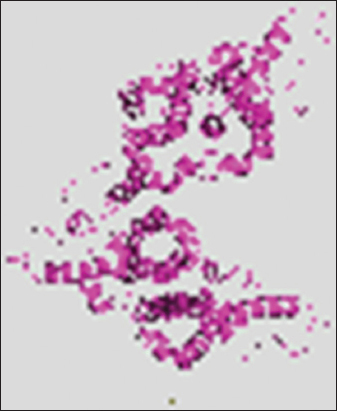
Figure 2: Iodixanol-Hepatitis B virus capsid complex
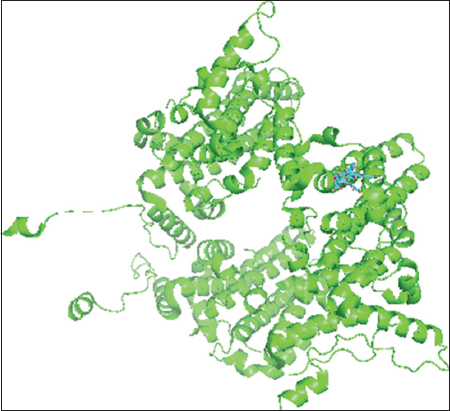
Figure 3: Iodixanol-Hepatitis B virus core protein complex
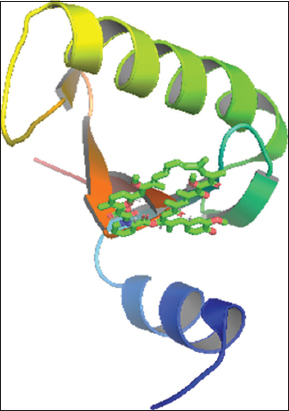
Figure 4: Sirolimus-Hepatitis B virus X interacting protein complex
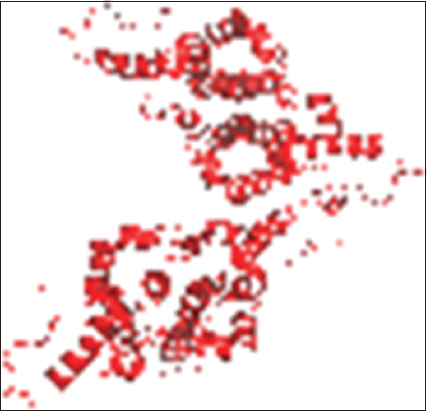
Figure 5: Sirolimus-Hepatitis B virus capsid protein complex
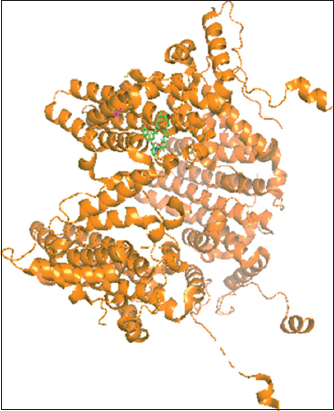
Figure 6: Sirolimus-Hepatitis B virus core protein complex
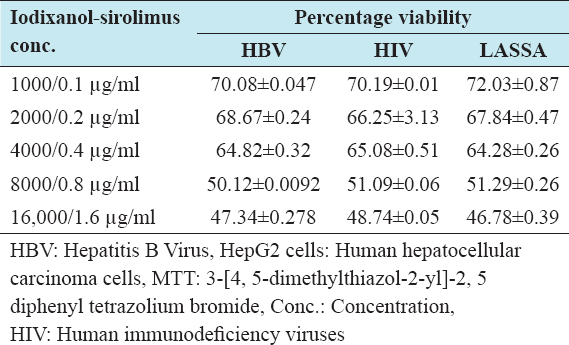
Percentage viability of combined iodixanol-sirolimus against HepG2 cell line from 3-[4, 5-dimethylthiazol-2-yl]-2, 5 diphenyl tetrazolium bromide (MTT) cytotoxicity assay
The percentage cell viability was <50% for HepG2 cell lines when treated with iodixanol-sirolimus concentration of >8000/0.8 µg/ml, as shown in Table 3.
Table 3: Percentage viability of combined iodixanol-sirolimus against HepG2 cell lines using MTT cytotoxicity assay
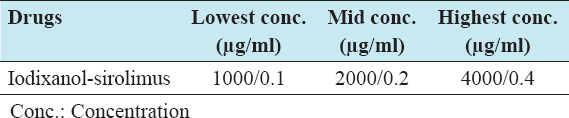
Three graded non-toxic concentrations of iodixanol-sirolimus for the in vitro antiviral drug combination studies
The three graded non-toxic concentrations for iodixanol/sirolimus combination selected from MTT cytotoxicity study were used for the antiviral study. The concentrations of the stock solution for each drug and the volume of stock to make the highest concentrations were calculated. This is to allow easy serial dilution during drug treatment [Table 4].
Table 4: Three graded non-toxic concentrations of iodixanol-sirolimus for the in vitro antiviral drug combination studies
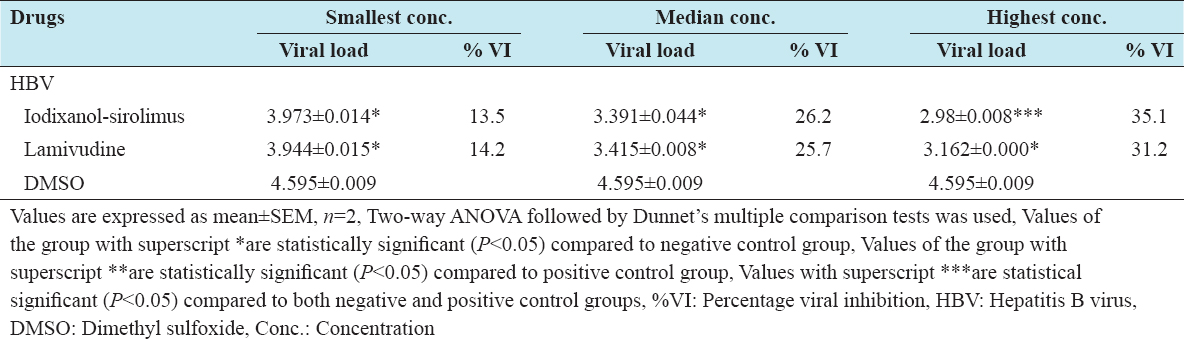
Virucidal effects of iodixanol-sirolimus combination against HBV
At the highest non-toxic concentration, iodixanol-sirolimus produced a statistically significant higher virucidal effect (35%) against HBV compared to lamivudine [Table 5].
Table 5: Virucidal effects of iodixanol-sirolimus combination against HBV
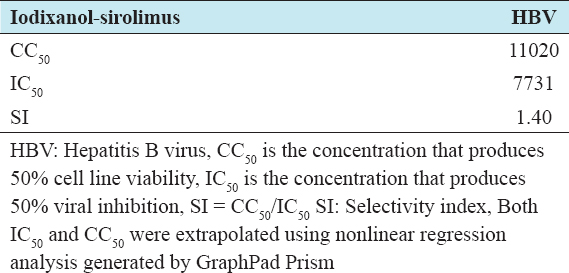
SI of the drug combination
Table 6 showed the SI of iodixanol-sirolimus combination against HBV infected cell lines. The higher the SI, the more effective and safe a drug would be during treatment.
Table 6: SI for iodixanol and sirolimus combination in cell-line infected viruses
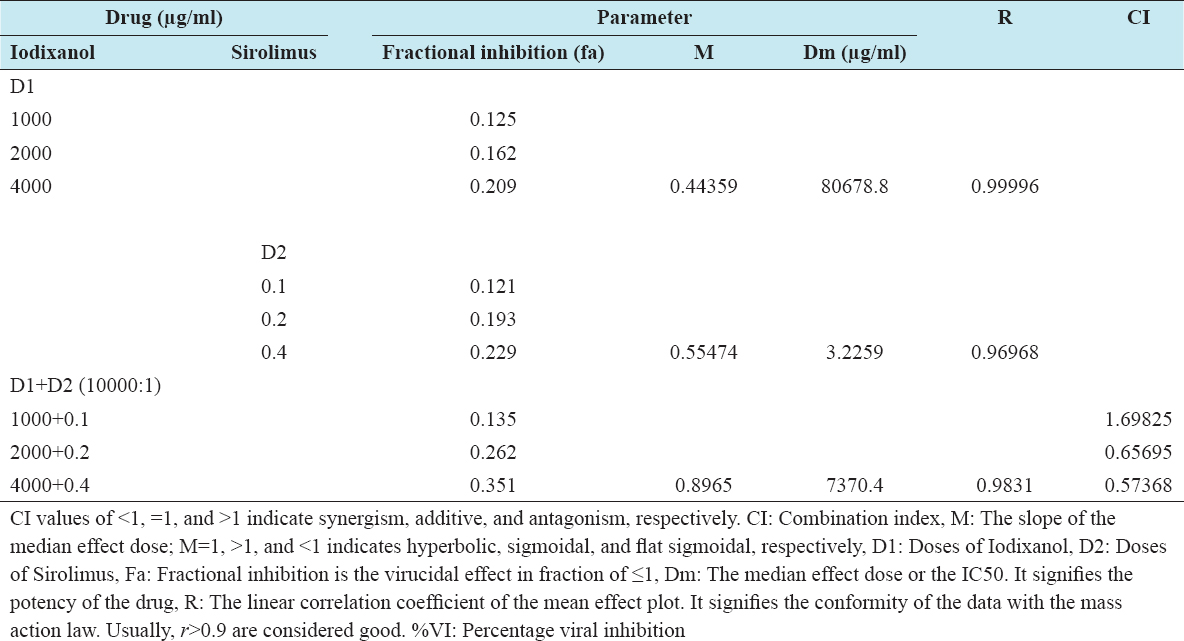
CI of iodixanol-sirolimus combination against HBV
As shown in Table 7, the median effect concentration of the combination against HBV was 7370.4 µg/ml which is far less than for iodixanol alone (80678.8 µg/ml). Synergism was demonstrated at the mid and highest non-toxic concentrations of 2000/0.2 µg/ml and 4000/0.4 µg/ml, respectively.
Table 7: Concentration effect (%VI) relationship of iodixanol, sirolimus, and the drug combination against hepatitis B virus infected HepG2 cell line
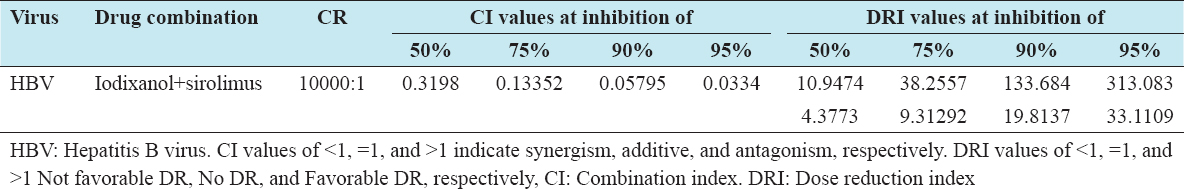
CI and DRI of iodixanol-sirolimus combination at 50%, 75%, 90%, and 95% VI against HBV
The synergism (CI <1) demonstrated by the drug combination increases with increasing effect levels (percentage effects). The DRI for the drug combination was favorable (DRI >1), and the value increases across the effects levels [Table 8].
Table 8: CI and DRI of iodixanol-sirolimus combination at 50%, 75%, 90%, and 95% viral inhibition against HBV
DISCUSSION
The study showed that iodixanol-sirolimus combination demonstrated a concentration-dependent HBV killing effect. The virucidal effect (35%) produced against HBV at the highest non-toxic concentration of the drug combination (4000/0.4 µg/ml) was significantly higher than the effect (31.2%) produced by lamivudine alone. Remarkably, synergism (CI <1) was demonstrated at mid and highest non-toxic concentrations of 2000/0.2 µg/ml and 4000/0.4 µg/ml. Again, the median effective concentration of the drug combination was 7370.4 µg/ml, by far less than for iodixanol alone (80,678.8 µg/ml), indicating the high potency of the drug combination. In addition, the DRI for the drug combination was favorable (i.e., DRI >1) in the treatment for HBV further buttressing the established synergistic effect of the drug combination. Interestingly, the SI for the drug combination against HBV infected cell line was 1.4, slightly >1.3, 0.9, and 1.0 for lamivudine, iodixanol, and sirolimus, respectively.
From the literature search using different search parameters, this study was the first to identify the anti-HBV effect of sirolimus. However, sirolimus an inhibitor of mammalian target of rapamycin (mTOR) was found to be a potent inhibitor of Hepatitis C virus (HCV) RNA replication using Huh-7.5 cells and primary human hepatocytes.[19] Again, in 42 HCV-infected liver-transplanted and kidney-transplanted patients who were switched to an mTOR inhibitor, decrease HCV RNA loads were reported.[20] It is also an established fact that efficient HCV RNA replication is dependent on the presence of the mTORC1 signaling pathway.[21] Sirolimus is also a central regulator of gene expression, translation, and various metabolic processes.[22]
From the literature search using different search parameters, no known study has reported the anti-HBV effect of iodixanol. However, copper iodide, an iodine-containing compound exert antiviral activity against H1N1 influenza by generating hydroxyl radicals.[23] Similarly, Povidone-iodine solution showed good efficacy against both enveloped and non-enveloped viruses including adenovirus and polyomaviruses.[24] Conflictingly, an antimicrobial study revealed iodixanol not to impede bacteria growth in a culture media.[25]
CONCLUSION
The result of the study showed that iodixanol-sirolimus combination produced a concentration-dependent viral killing against HBV. The low potency and SI of the two drugs against the infected cell line are the issue of concern. Synergism was demonstrated against HBV.
It can be concluded that there exist generic drugs with activity against HBV.
Further evaluation of the iodixanol and sirolimus against the three viruses using different cell lines followed by in vivo studies at biosafety level IV is recommended.