INTRODUCTION
Overview
The BS 1881: Part 125: 1983 – Testing concrete – Methods for mixing and sampling fresh concrete in the laboratory is set to consider the methods of mixing concrete in terms of sample preparation, mixing, and testing. The testing process included is slump and plastic density test.
In the first section of this report, the mix design procedures will be described along with its five stages and group results. The calculations of the mix design will be shown step by step for the 100% gravel of a 0.45, 0.6, and 0.75 water/cement (W/C) ratio, to obtain the mix proportions for concrete mixes and the batch quantities allowing for absorption.
The mix proportions for concrete mixes of the 100% gravel, 100% recycled aggregate, 30% fly ash/gravel, and 10% silica fume (SF)/gravel will be shown in the form of tables along with the corrected mixes. In addition to this, the batch quantities allowing for absorption tables will be introduced, with some discussion on the reasons of adding extra water.
A step-by-step procedure of the concrete mixing will be presented with the work carried out in the laboratory. Moreover, a brief discussion on the slump and plastic density tests will be introduced in this report. The results of the properties of fresh concrete mix will be commented on, such as aggregate type, cement type, amount of fine aggregate, and W/C ratio.
Finally, as part of the discussion in this report, the yield will be calculated with the corrected mix proportions and difference between design/plastic and volumetric method will be explained.
Main Aims of the Experimental Study
The main objectives of the experimental testing were as follows:
-
To achieve a better understanding of the concrete mix design process.
-
To calculate the mix proportions for concrete mixes and batch quantities allowed for absorption.
-
To obtain a greater in-depth knowledge of the mixing procedure and tests carried out in laboratory.
-
To become familiar with the fresh properties of concrete.
-
To be able to correct mix proportions.
-
To distinguish between the design/plastic and volumetric method.
-
To discussing fresh properties in terms of aggregate type, cement type, amount of fine material, W/C ratio, and the SP amount required for workability.
The major points of the testing were as follows:
-
Carrying out mix design for 0.45, 0.6, and 0.75 W/C ratios for uncrushed gravel 100%.
-
Calculating batch quantities allowed for absorption.
-
Mixing concrete according to the building research establishment mix design.
-
Carrying out the slump and plastic density tests.
-
Observing the fresh properties of concrete, such as bleeding, segregation, cohesiveness, compactability, finishability, and general overall observation of the mix.
-
Casting appropriate specimens.
-
Curing the specimens as required.
-
Demolding the specimens after 24 h.
MIX DESIGN
Mix Design Procedures
The required details for designing concrete mix are cement type, aggregate type, maximum aggregate size, fine aggregate grading, aggregate relative densities, fresh concrete properties, and Hardened concrete properties. The aggregate type used is 100% gravel and three W/C ratios 0.45, 0.6, and 0.75.
The order of concrete mix design procedures consists of five stages as follows:
-
Stage 1 is set out to find the free W/C ratio.
-
Stage 2 is set out to find the free water content, through approximate free water contents (kg/m3) required to give various levels of workability.
-
Stage 3 is set out to find the cement content, from equation (1).
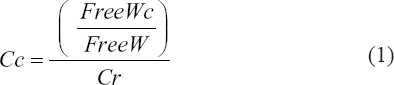
Where, Cc is the cement content, FreeWc is the free water content, FreeW is the free water, and Cr is the cement ratio.
-
Stage 4 is set out to determine the total aggregate content. First, through estimated wet density of fully compacted concrete to find the concrete density. Second, using equation (2).

Where, TAc is the total aggregate content, D is the wet density of concrete (kg/m3), C is the cement content (kg/m3), and W is the free water content (kg/m3).
-
Stage 5 is set out to find the fine and coarse aggregate contents. First, through the recommended proportions of fine aggregate according to percentage passing a 600 µm sieve to find the proportion of fine aggregate. Second, using equations (3) and (4), respectively.

Where, FAc is the fine aggregate content, TAc is the total aggregate content, and Pf is the proportion of fines.

Where, CAc is the course aggregate content, TAc is the total aggregate content, and FAc is the fine aggregate content.
Each of the above stages deals with a particular aspect of the design, leading to the final mix proportions (kg/m3) and the batch weights (kg). The factor that has been considered during the mix design is fresh concrete workability, durability, and compressive strength.
100% Gravel Uncrushed (0.45 W/C Ratio)
The 0.45 W/C ratio with a cement type of 52.5N, aggregate type gravel uncrushed, maximum aggregate size 20 mm, aggregate density of 2600 kg/m3, sand density of 2600 kg/m3, fine aggregate grading of 44%, and 180 l/m3 water content and with a slump between 30 and 60 mm.
By applying the mix design procedure, stages stated in Section 2.1, for Stage 1, the free W/C ratio is 0.45 for aggregate type uncrushed 100% gravel and the maximum free W/C ratio using the lower value 0.45 W/C ratio. Stage 2, the free water content slump or Vebe time specified slump is between 30 and 60 mm and the maximum aggregate size specified 20 mm. Accordingly, using the table of approximate free water contents kg/m3 required to give various levels of workability in the engineered concrete mix design and test methods, the free water content is 180 kg/m3. For Stage 3, the cement content using equation 1 is 400 kg/m3 and the modified free W/C ratio is 0.45. Furthermore, Stage 4 gives a relative density of the aggregate of 2600 kg/m3 for total aggregate content. Using the appropriate graph for estimated the wet density of fully compacted concrete, the concrete density is 2370 kg/m3 and the total aggregate content using equation 2 equals to 1790 kg/m3. Finally, for Stage 5, for the fine and coarse aggregate content, the grading of fine aggregate is 44% for maximum aggregate size of 20 mm, the proportion of fine aggregate equals 37%. Therefore, using equation (3), the fine aggregate content is 662 kg/m3 and the coarse aggregate content is 1128 kg/m3 using equation (4).
Mix Proportions for Concrete Mixes
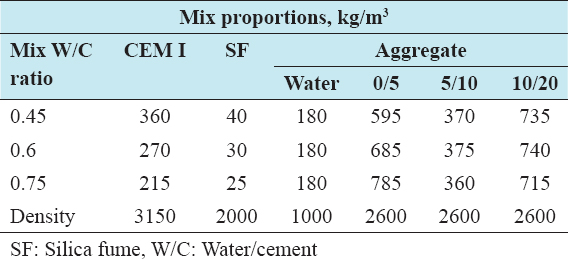
The same mix design procedure has been carried out for 0.6 and 0.75 W/C ratio and the following Tables 1-4 show how the mix proportions that have been obtained.
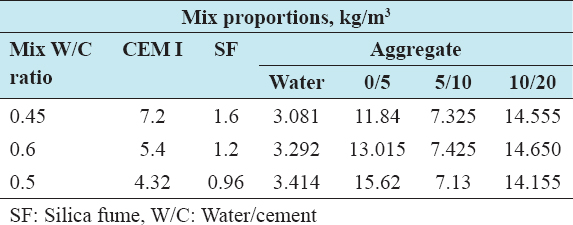
Table 1: Mix proportions for 100% gravel
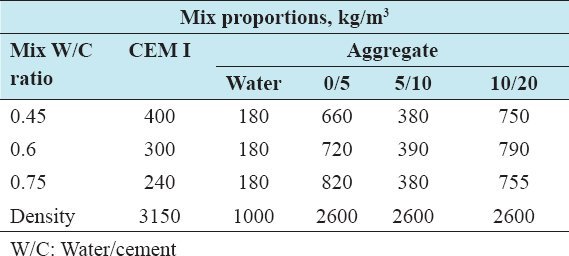
Table 2: Mix proportions for 100% RA
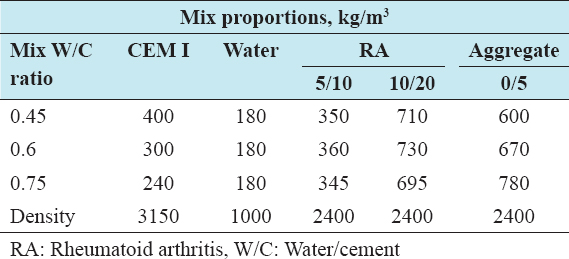
Table 3: Mix proportions for 100% FA
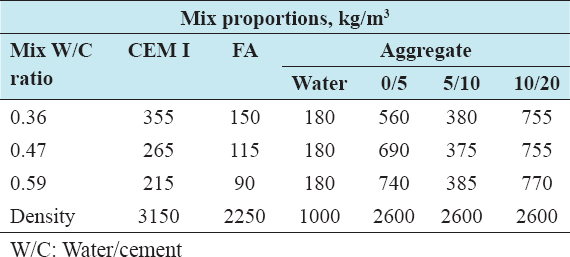
Table 4: Mix proportions for 100% SF
Batch Quantities Allowing for Absorption
Batch quantities are the quantities of materials such as cement, fly ash, SF, water, recycled aggregate, and aggregates required for a concrete mix process. The batch quantities for the concrete mixes are presented in Tables 5-8. Moreover, the following equation (5) is used to find the batch quantities allowing for absorption:
Table 5: Batch quantities for 100% gravel
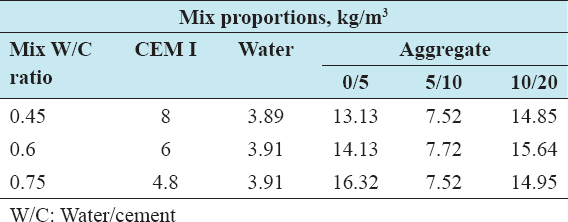
Table 6: Batch quantities for 100% RA
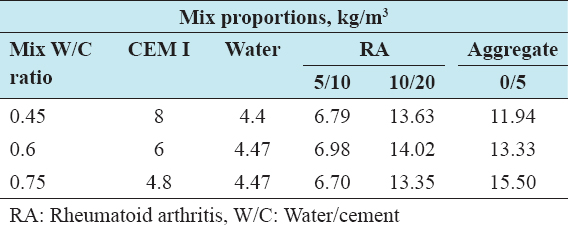
Table 7: Batch quantities for 100% FA
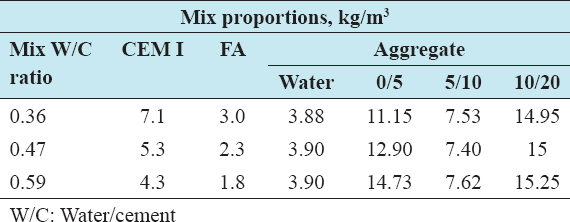
Table 8: Batch quantities for 100% SF

Where, AAbw is the adjusted aggregate batch weight in (kg), Abw is the aggregate batch weight (kg), and Aw is the absorbed water (kg).
The main reason for adding extra water is for absorption of water by the aggregate and due to the characteristics of the aggregate to produce concrete of a specified slump. This depends on the W/C ratio, cement-aggregate ratio, maximum aggregate size, and the type, shape, grading, surface texture, absorption capability, strength, and stiffness of aggregate particles. The following equation (6) is used to find the additional water required:

Where, Awr is the additional water required (kg), Mbw is the material batch weight (kg), and Av is the absorption value %.
The absorption values for gravel 5/20, sand 0/5, RA 5/10, and RA 10/20 are 1%, 0.5%, 3%, and 4%, respectively.
Experimental Mixing Procedure and Tests Carried Out
Mixing of concrete
The mixing of concrete was according to BS 1881: Part 125: 1983 – Testing concrete – Methods for mixing and sampling fresh concrete in the laboratory. A lightly dampen mixer pan and paddles have been used to carry out the mixing. First, the following was added in order: Coarse aggregate, fine aggregate, and sand and mixed for 30 s. After that, half of the mix water was added and mixed for another 1 min. Then, the lightly dampen mixer was left covered for 8 min for the aggregates to absorb water. Afterward, the cement was spread evenly over the aggregates and mixed for 1 min. The next step was cleaning the paddles and mix material carefully by hand. Finally, the remaining water (with added superplasticizers) was added to mix and followed by a further mixing for 2 min. Additional hand mixing has been carried out to ensure homogeneity.
Slump test (Workability)
The slump test [Figure 1] was according to BS EN 12350-2:2000 – Testing fresh concrete – Part 2: Slump test. First, the inside surface of the slump cone was gently moisten using a damp cloth. After that, the cone was placed on a level surface and held firmly in position using footrests. Afterward, the slump cone was filled with the freshly mixed concrete in three layers of equal height, using a metal rod each layer has been temped 25 times. The next step was to clean and remove the excess concrete from the top and around the base of the cone. Then, the cone was gently lifted vertically and the cone was inverted and placed next to the slumped concrete. Finally, the vertical distance from the top of the cone to the highest point of the slumped concrete has been measured and all equipments were cleaned.
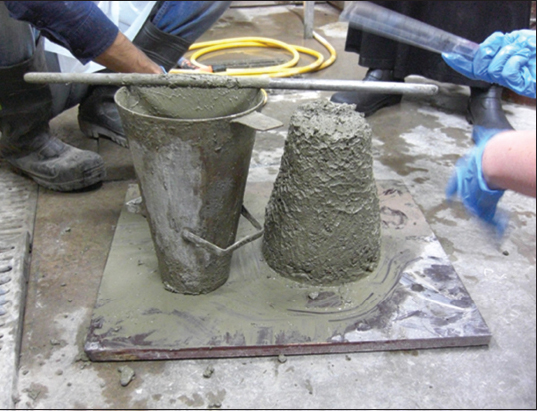
Figure 1: Slump measuring and testing
Plastic density
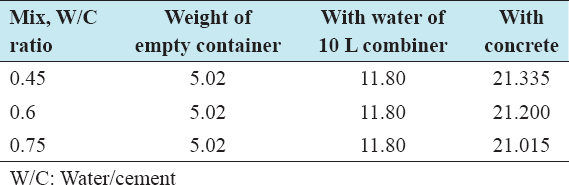
The plastic density test was done according to BS 12350-6, 2000 – Testing concrete – Method for determination of density of compacted fresh concrete. First, the mass of an empty 10 L steel container has been recorded to the nearest 0.01 kg. After that, the container was filled with water so that no meniscus is above the rim. Then, the container was reweighed to obtain mass of water in container to the nearest 0.01 kg. The next step was to empty the container from water and carefully fill it with concrete in six equal layers. Each of the layers has been compacted fully on the vibrating table. Then, the final layer has been smoothed with a float to level with the top container. The next step was to skim the concrete surface with 300 mm steel rule, and the outside of the container has been cleaned thoroughly and reweighed. Finally, the concrete has been returned to the mixer and remixed for 30 s. Plastic density results are demonstrated in Table 9.
Table 9: Results for the plastic density test for 100% gravel (kg)
After carrying out the mixing of concrete, slump and plastic density tests, returning, and remixing the concrete for 30 s, the concrete was casted in 1 cylinder (100 mm × 300 mm in diameter), 1 prism (100 mm2 × 500 mm), 6 cubes (100 mm3), and 1 cube (150 mm3) for test specimens. In addition, curing of the test specimens has been carried out to avoid water loss from the concrete. Finally, the mixer has been cleaned thoroughly and the concrete has been removed from paddles. The casting of the concrete specimens is illustrated in Figure 2.
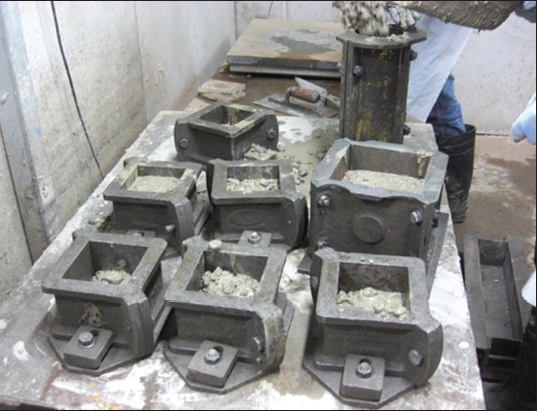
Figure 2: The picture shows the casting of concrete for testing specimens
The calculation for plastic density which was in the concrete laboratory using the formula (7) below:
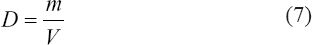
Where, m is mass of concrete in container (to the nearest 10 g) and V is volume of container which is the mass of water in container (from calibration) divided by 1000 to the nearest 0.00001 m³ equals to 0.01 m³ (approximately).
Accordingly, the plastic density for 0.45 W/C ratio is:
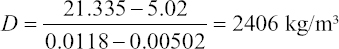
To the nearest 10 kg/m³ D ≈ 2405 kg/m³.
Yield: Corrected Mix Proportions and Differences between Design/Plastic and Volumetric Method
Adjusting for yield
The yield has been calculated for each of the three W/C ratios 0.45, 0.60, and 0.75 and tabulated in Table 10.
Table 10: Density, corrected density, and actual plastic density (kg/m3)
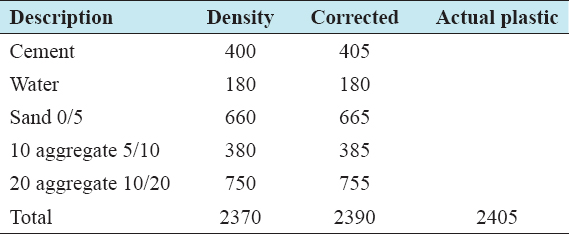
The corrected density has been calculated using equation (8) below:
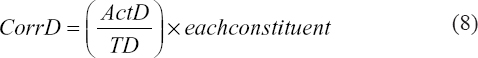
Where, CorrD is the corrected density, ActD is the actual density, and TD is the total density.
Volumetric method
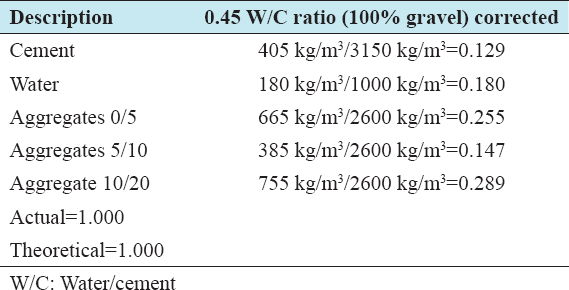
The reason behind calculating the yield is to find the corrected mix proportions and comparing the corrected density with actual plastic density. Moreover, it is calculated to compare the correction factor of actual and theoretical methods. There are two types of methods, one is calculated design/plastic and the other is volumetric method.[1] The volumetric method appears to be more efficient and reliable than design/plastic because it is more accurate and close to actual. In addition, its approach is more practical and close to real on-site conditions. On the other hand, the design plastic method is more theoretical and based on quite a few assumptions, which lead to more errors, greater time consumption and is difficult to handle.[2] The volumetric calculations for 0.45 W/C ratio 100% gravel and corrected gravel are presented in Tables 11 and 12, respectively.
Table 11: Volumetric tabulated calculation for 0.45 W/C ratio (100%) gravel
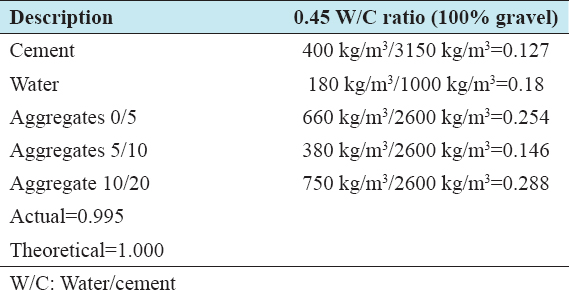
Table 12: Volumetric tabulated calculation for 0.45 W/C ratio (100%) gravel corrected
RESULTS AND COMMENTS ON FRESH PROPERTIES
100% Gravel
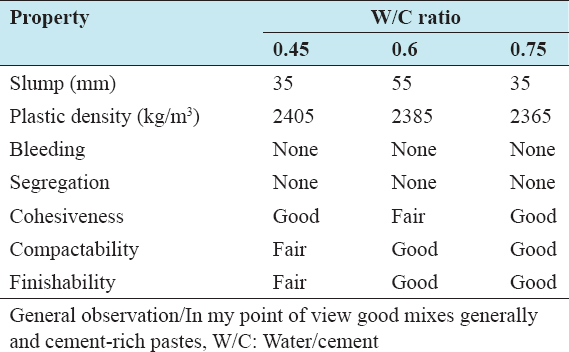
The gravel [Table 13] has given the concrete good compactability and finishability apart from 0.45 W/C ratio mix, which had relatively below par. This is due to the shape of the aggregate and water absorption value of gravel. Although the concrete had a cement-rich paste, the Portland cement (CEM I) has worked sufficiently as a binder between sand and gravel, for a good fresh concrete with good cohesiveness and compactability.[3] The amount of sand that has been used was 13.13, 14.33, and 16.32 kg, respectively, for W/C ratios, which seem to be reasonable amounts for the fresh concrete properties for 100% gravel mix. The design mixes of 0.45, 0.6, and 0.75 W/C ratio seem to be acceptable since the slump for each W/C ratio is reasonable and within the required range of 30–60 mm slump. Same applies for plastic density with a good and within range results. In addition, the amount of glenium 51 used was 0.15%, 0.12%, and 0.10% played an important role in preventing bleeding or segregation and improved finishability. In general, the mixes were good and reasonable and with cement-rich paste.
Table 13: Fresh concrete properties for 100% gravel
The volume of concrete produced using the equation (9):
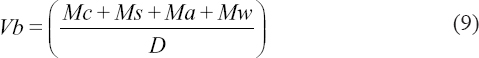
Where, Mc is batch quantity of cement (kg), Ms is batch quantity of fine aggregate in laboratory dry condition (kg), Ma is batch quantity of coarse aggregate in laboratory dry condition (kg), Mw is batch quantity of mix water (kg), and D is plastic density of fully compacted concrete (kg/m³).
Accordingly, the volume of concrete produced (Vb) for 0.45 W/C ratio is:
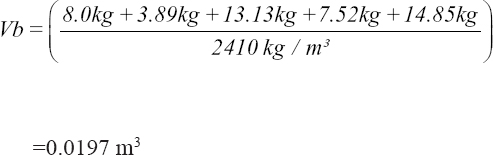
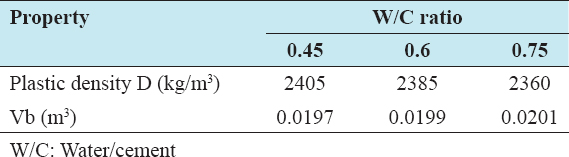
Where , Vb has been expressed to an accuracy of 1%, for example, to the nearest 0.0001 m³ for a 0.01 m³ size mix. The same calculations have been carried out for 0.6 and 0.75 W/C ratios and the following Table 14 shows the results.
Table 14: Plastic density and volume of concrete produced for 0.45, 0.60, and 0.75 W/C ratio
100% Recycled Aggregate
The absorption value for this recycled aggregate was too high; therefore, it affected the workability by causing high slumps, due to more water in the mix. For the three W/C ratios, the slump collapsed with values of 185, 195, and 195 mm, respectively. However, on the other hand, the use of recycled aggregate resulted in mix with good compactability and finishability. Portland cement (CEM I) was added to this mix.[4] The amount of Portland cement in this mix was not enough to increase the workability, cohesiveness and inhibit bleeding. In addition, the cohesiveness was poor and there was slight bleeding. The amount of sand in this mix was as follows: 11.94, 13.33, and 15.5 kg in respect with 0.45, 0.60, and 0.75 W/C ratios. This amount was not enough to decrease bleeding and reduce segregation and slight bleeding and segregation were noticed. With an amount of 0.4, 0.6, and 0.75 W/C ratios, it shows from the results that there was more water in the mix causing high slumps. Moreover, the amount of glenium 51 used was 0.15%, 0.12%, and 0.10%. Although this amount of superplasticizer maintained good finishability, it did not help in improving bleeding and segregation, due to more water in mix. In general, the absorption value was probably too high for this RA in Table 15, therefore, leading to more water in mix, causing high slumps. The density of this recycled aggregate was probably >2400 kg/m3 assumed in design stage and it is more likely to be 2550 kg/m3.
Table 15: Fresh concrete properties for 100% RA
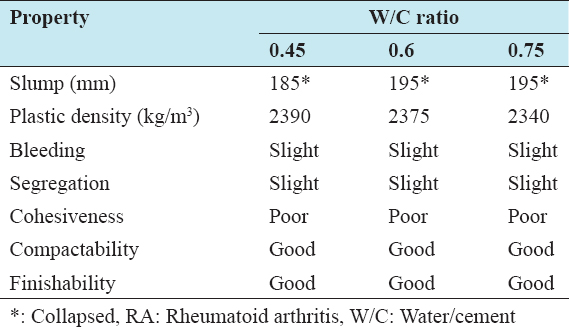
General observation/absorption value probably is too high for this RA, therefore, more water in mix causing high slumps and the density of this RA was probably >2400 kg/m³ assumed in design stage. To be more precise the value was about 2550 kg/m³.
30% Fly Ash
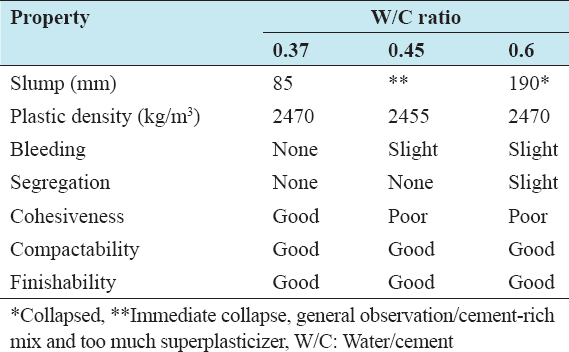
The role of gravel on concrete is that it gives the concrete good compactability and finishability. Thus, the compactability and finishability were good for this concrete mix. Portland cement has reduced bleeding and gave a good cohesiveness in this mix for 0.37 W/C ratio, but for 0.45 and 0.6 W/C ratios, there was a slight bleeding and cohesiveness was poor. In general, it is observed that this mix is a cement-rich mix. The amount of fly ash added was 3, 2.3, and 1.8 kg in respect with W/C ratios of 0.36, 0.47, and 0.59. Fly ash is extremely high fine material. Due to its spherical shape and plain surface of particles gives it an advantage in terms of water requirement in concrete mix.[5] The results of fly ash mix as shown in Table 16 have improved the compactability of the mix and gave a better finish. Since fly ash is more effective against segregation, it had greater effect on segregation, by having no segregation for both 0.37 and 0.45 W/C ratios and slight segregation for 0.60 W/C ratio. It is believed that the slump for this concrete mix was high with W/C ratios of 0.37, 0.45, and 0.60. The amount of superplasticizer used was 0.30%, 0.33%, and 0.33%, respectively, for the above-mentioned W/C ratios. The above amount of glenium 51 was too much, and thus, chemical reaction did not take place properly in the mix. Therefore, it did not help in producing high workability without segregation or bleeding.
Table 16: Fresh concrete properties for 30% FA
10% Silica Fume
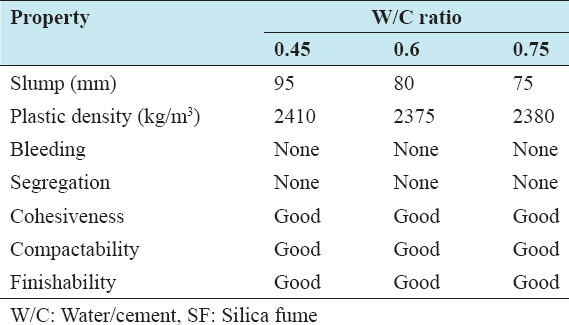
In this mix, the gravel has given the fresh concrete good compactability and finishability. Portland cement (CEM I) has worked effectively as a binder between sand and gravel, for a good fresh concrete with good cohesiveness and compactability. The role of SF on concrete is that it gives concrete lower permeability by providing unprecedented reactions in permeability and complete control of bleeding. Silica fume is an extremely fine and very reactive with spherical shape particles. Therefore, there is no sign of bleeding in the mix due to presence of SF. The amount of sand in this mix was as follows: 12.89, 13.61, and 14.04 kg, respectively, for 0.45, 0.60, and 0.75 W/C ratios. These amounts seem to be fine since the results of fresh concrete properties were in accord with the requirement. For 0.45, 0.6, and 0.75 W/C ratio, the slumps were a bit high with 95, 80, and 75 mm. In addition, plastic density was fine and within the acceptable range of 2400 kg/m3 ± 20 kg/m3. Moreover, the amount of glenium 51 used was 0.15%, 0.12%, and 0.10%, respectively. These amounts presented reasonable workability with no segregation or bleeding in fresh concrete. Table 17 demonstrates the fresh concrete properties for 10% SF.
Table 17: Fresh concrete properties for 10% SF
CONCLUSION
Having completed this experimental study, new aspects have been learned, such as calculating a concrete mix design to obtain mix proportions and batch weights. Mixing concrete with accordance to BS 1881: Part 125: 1983 – Testing concrete – Methods for mixing and sampling fresh concrete in the laboratory and carrying out slump and plastic density tests. In addition, it is found that the amount of water absorbed by the aggregate depends on many factors such as W/C ratio, cement-aggregate ratio, maximum aggregate size, and the type, shape, grading, surface texture, absorption capability, strength, and stiffness of aggregate particles. Moreover, the volumetric method found to be more effective than design/plastic method because it is more accurate and close to actual. Furthermore, it is observed that the fresh properties of concrete are affected by many factors such as aggregate type, cement type, amount of fine material, W/C ratio, and amount of superplasticizer added to mix.
The results of 100% gravel established a good concrete mix. The slump expressed good workability by presenting acceptable and within range results between 30 and 60 mm. Moreover, the result for plastic density was fine with values of 2405, 2385, and 2365 kg/m3. In addition, there was no bleeding or segregation with an overall good cohesiveness, compactability, and finishability. The aggregate type 100% gravel, CEM I, amount of fine aggregate, W/C ratio, and the right amount of superplasticizer used had a huge impact in maintaining such good fresh properties of this concrete mix. Finally, with some improvements on the tested fresh concrete it can be suitable for the usage in the construction site. Such improvements may be by reducing the amount of cement in the concrete mix.