INTRODUCTION
Adequate power supply is essential for a country’s development,[1] and this involves capital intensive activities demanding huge resources of both funds and capacity. In Nigeria, an economy just shedding off the effects of recession and with the resultant effects of cash paucity, the need for generation, transmission, and distribution of power through a more efficient means cannot be overemphasized, to address the power problem. One attractive prospect to the challenges of the power sector, among others, is the use appropriate maintenance technique to increase the efficiency of power system.[2] Knowing full well that the inadequacy of it could intensify energy poverty.[3] According to the International Energy Agency IEA, approximately 1.3 billion people live without electricity, which constitutes 18% of the global population. Till date, about 1.3 billion −1.6 billion people in the world of which many of whom live in isolated areas do not have electricity, clean water, good education, primary health care, and other basic services; the effect of which to a large extent depends on access to electricity.[4,5] At the present time, the major energy demands are met by conventional energy resources like coal, natural gas, crude oil, etc. which are fast depleting, finite and are threatening the future energy demands. More so, the emission of greenhouse gases is caused by the combustion of fuels which enhances environmental problems.[6] Furthermore, the fossil fuel combustion is raising concerns about the climate change and other health hazards. When electricity delivered is strongly dependent on centralized energy systems which operate mostly on fossil fuels, it attributes to high costs of delivery, for establishing transmission and distribution grids that can penetrate remote regions.[7] According to Anderson and Agarwal,[8] the authors designed a reliability block diagram for a protection system in a substation and concluded that redundancy plays an important factor in determining the availability of the system.
The power transmission system is a highly sensitive and safety critical domain. Faults such as switching surges and short circuits cannot only damage the sophisticated and expensive components, like transmission lines or transformers, but could also lead to catastrophic consequences like the 2005 Moscow power blackout.[9] This is the same in Nigeria, but due to poor database management, facts are not properly documented. To protect the power transmission systems and their components, it has now become customary to associate a protective relay with every safety critical component of a power transmission system. The Sapele Work Centre Transmission was founded on January 17, 1992. The work center consists of three substations; these are Sapele 330kv Transmission station, Amukpe 132/33kv Substation, and Effurun 132/33kv sub-station. The work center is responsible for the maintenance and operation of transmission network including supply of bulk power to the following states: Delta State and Edo State. The single line diagram of the network is shown in Figure 1. Hence, this research work is aimed at carrying out analysis on the relays in Ogorode transmission station, Delta State, Nigeria, to determine how reliable it is using historical failure data.
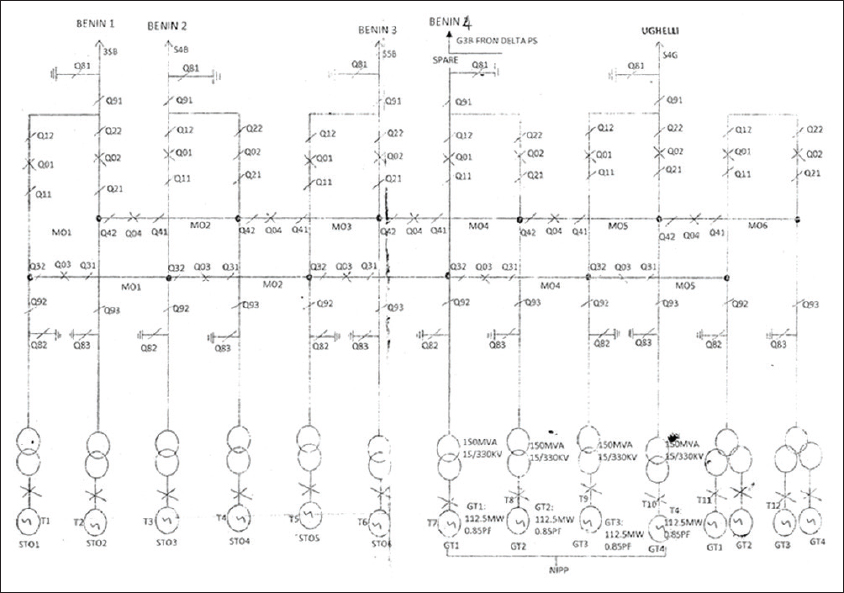
Figure 1: Single line diagram of 330kV ogorode transmission station
METHODOLOGY
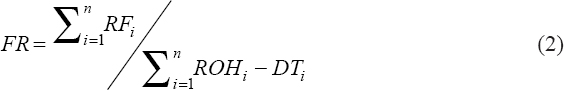
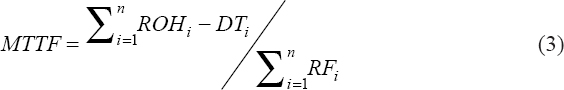
The method used in this research work is solely dependent on the data obtained from the company log books to calculate the parameters needed for the relay reliability analysis. Operational data for 4 years (2013–2016) comprising forced outage reports on relays, the date, name of the sub-regions/work centers, name of the substation, transmission lines nomenclature, voltage level, relay tripping indication, cause of the outage, time out, outage duration (h), last load recorded (MW), and energy loss (MWhr) per each outage were collated in addition to personal visit to the control room to see how these data are taking and recorded by operators in the events of failure. The indices of reliability have been calculated using equations 1–6[10] to determine, among others, the level of reliability as well the failure rate of protective relay in the station. Thereafter, codes were written in the MATLAB environment to generate and validate the mathematical model of the reliability and failure rate of the relay. Eventually, the generated model was used to predict the behavior of the relay in the future. In this research, protective relays are assumed to be non-repairable. This assumption was derived from discussion with protection personnel in Ogorode Transmission Company, which concluded that protective relays are normally replaced with a new one once failed:
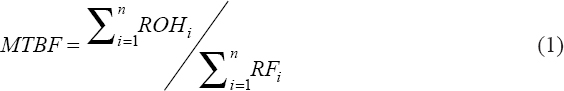
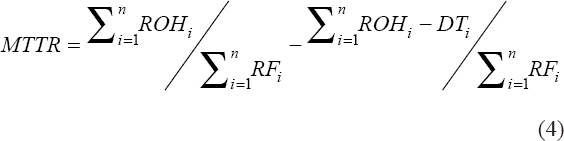

Where
ROH = relay operating hour
RF = Relay failure
DT = Downtime
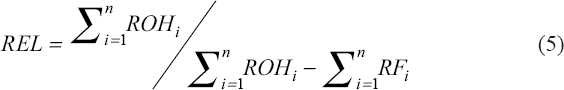
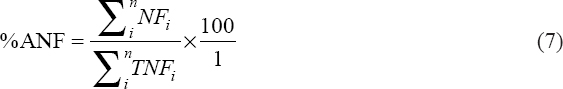
NF = Average number of failures in the study period
TNF = The total number of failure in the study period
% ANF = Average number of failure in percentages.
The MATLAB 2015 program was employed in generating the codes subsequently, mathematical models of the relays reliability were developed. The reliability of the relay was modeled as a polynomial function through the use of curve fit tool program in the MATLAB environment based on data collected. The resulting expression under running of the codes is given in equation 8.

Where;
R = Reliability
X = Time
a1 = −0.02833
b1 = 0.225
c1 = −0.5467
d1 = 1.32.
Similarly, the MATLAB program shown in Appendix B is employed in generating the mathematical model of the failure rate of the relay. The failure rate of the relay is also modeled as a polynomial function of degree three. This also is achieved through the use of curve fitting tool program in MATLAB as contained in Appendix B. This is done to obtain a general expression that models the behavior of the relay failure rate based on the collected data.
The resulting equation on running the codes contained in Appendix B is given in equation 9.

Where
FR = Failure rate
x = Time
a2 = −0.022
b2 = 0.2275
c2 = −0.7575
d2 = 0.8740.
The monthly reliability of the relay for the year 2017 is predicted using its mathematical model which is achieved through simulation of its Simulink model with the appropriate input values. Table 1 shows the predicted values of the reliability for January–December 2017 [Table 2 and Figure 2].
Table 1: Reliability indices for relay
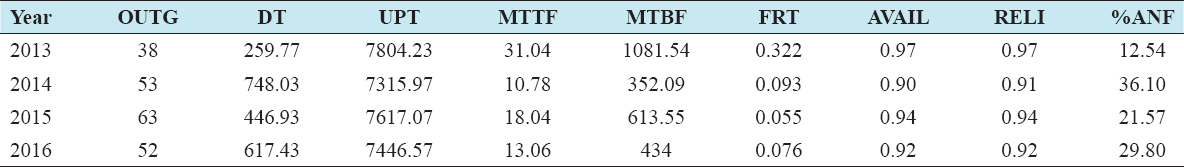
Table 2: Predicted monthly reliability of relays for 2017
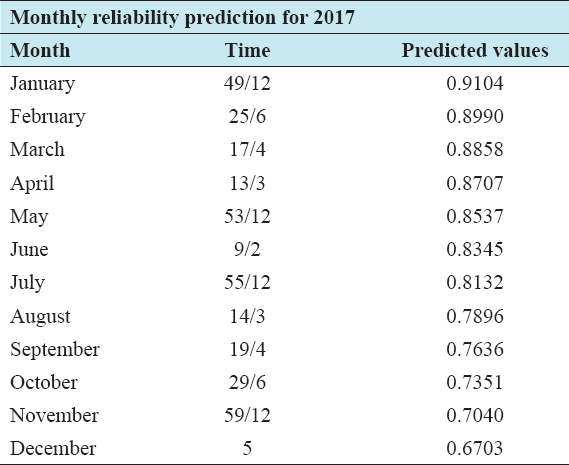
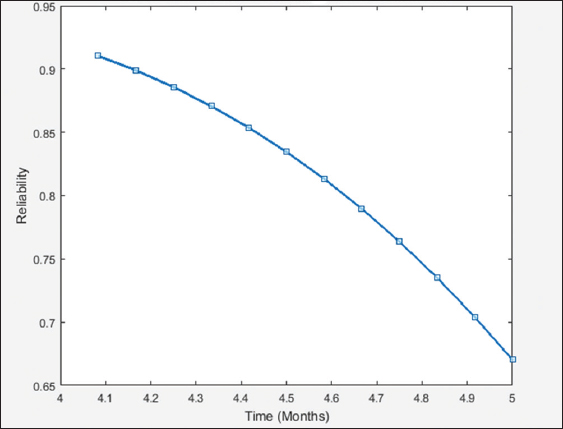
Figure 2: Plot of predicted reliability with time 2017
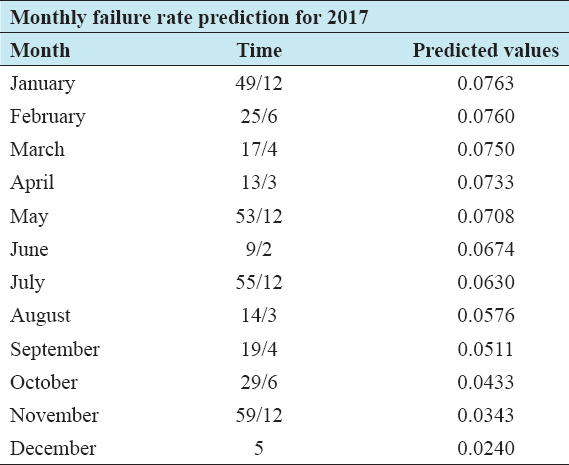
The monthly failure rate of the relay for the year of 2017 was also predicted using the obtained mathematical model which is achieved through the writing of codes in the MATLAB environment as shown in Appendix B. Table 3 shows the predicted values of the failure rate for the month of January–December 2017.
Table 3: Predicted monthly failure rate for 2017
In many cases, computed data are plagued with errors, and the generated or fitted equation may be taken to be a better representation of the actual relationship between the dependent and independent variables than the collected data. To test the validity and accuracy of a given fitted equation, the following can be carried out to getting an estimate of the error of the fit. The first areas of interest we can use to look at how good the fit is are the residuals. Suppose that we are fitting a function f(x) to a set of collected data ti. The sum of the squares of the residuals is given as follows:

Now let the collected data have a mean or average value given by The sum of the squares of the deviation of the collected data from the mean is:

The r-squared value is then computed as follows:

If r2 = 1, then the function would be a perfect fit to the collected data. Hence, the closer r2 is to 1, the better the fit.
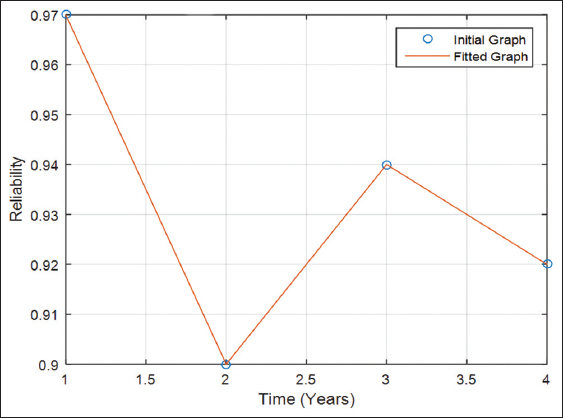
The above model validation computation can be done through the use of MATLAB codes. The MATLAB codes for the computation of r2 value for reliability and failure rate of the relay are given in Appendix C and D [Figure 3].
Figure 3: Fitted plot of the reliability with time
RESULTS AND DISCUSSION
The monthly failure rate of the relay for the year of 2017 is predicted using the generated mathematical model. Tables 2 and 3 show the predicted values of the relay reliability and failure rate, respectively, for January–December 2017. It is obvious from the results in Tables 4 and 5 that the models generated are well fitted for the collected data. Furthermore, it can be seen from Figure 4 that the rate of failure of the relay decreases with time and this is an indication that the relay is mostly affected by random external event.
Table 4: Comparison of computed and fitted values of the relay reliability
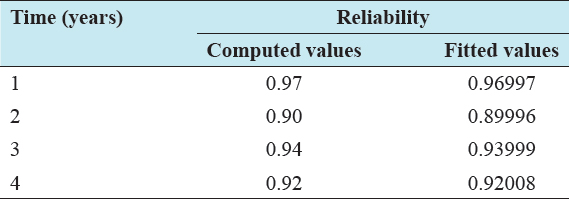
Table 5: Comparison of computed and fitted values of the relay failure rate
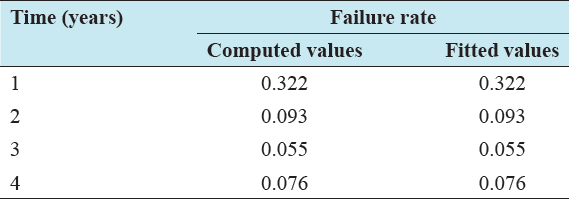
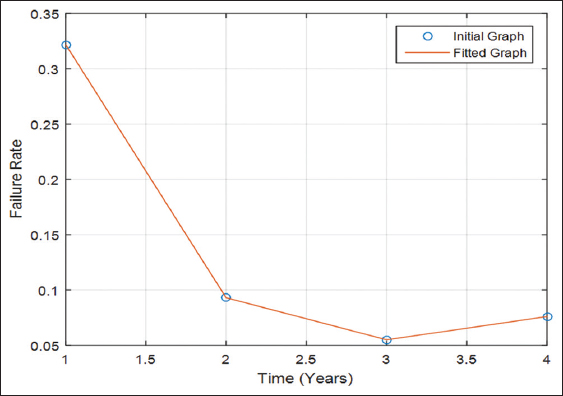
Figure 4: Fitted plot of failure rate with time
CONCLUSION
According to the property of relay protection system, this research uses the historical forced tripping of the breakers to analyze the MATLAB which was used for the analysis of the relay reliability. The developed model validation and computation are done through the use of MATLAB codes. The mathematical model developed is used to predict the reliability and failure rate of relays in 2017, this is to test its accuracy, and hence, this method provides alternative to other methods used for the same purpose.