INTRODUCTION
Delays and queuing problems are the most common features not only in our everyday living conditions, such as in a bank or post office, ticket office, public transport, or traffic area, but also in more technical environments such as production. Their network computers and telecommunications play an important role in the business process and design their advertising goals.[1] Analyzer queuing models provide a powerful tool for designing and evaluating the performance of categorization systems.[2] Whenever customers arrive at a service facility, some of them must wait before receiving the desired service, which means that the client must wait, it may be on the same line.[3] Customers enter with different services with different queues, each with a server (sales feedback):[4] (Customers select a server queue based on some mechanism (zero, shortest queue, or shortest load). In this paper, the quadratic theory review and for the empirical review, the sales service department of the sales department of a large store is selected, for example. The main purpose of this paper is to examine the use of queuing theory and the evaluation of the parameters associated with the single service for the operation of the supermarket service. Therefore, a mathematical model has been developed to analyze the performance of the service unit checking. Two important results from the data collected in the supermarket using the mathematical model should be known: one is “the rate of service provided to customers during the checking process, and the other the gap between the time of arrival (time to time) per customer perhour To obtain an overview of the quality of customer service, questionnaires that show the results in percent are also used to directly assess customers).[5] Therefore, a mathematical model for analyzing the performance of a service unit checks the development of data. Two important conclusions from the data collected in the supermarket using the mathematical model should be known: One is the rate of service provided to customers during the checking process, and the other is the gap between the arrival time (time to time) poer hour per customer. To obtain an overview of the quality of customer service, questionnaires that show the results in percent are also used to directly assess customers.[6]
RELATED WORK
-
Antoine Avei, J. UG, in his article, entitled “Managing efficient queues in supermarkets: a case study of the Uruguayan city of Nigeria,” Univomare, Manage management traits in Nigeria again by studying the city of Maqoroudi. The analysis shows that, overall, queuing management in the capital city of Makrodari is largely inadequate, inefficient, and ineffective. As a result, this article offers suggestions.
-
Parianjikay and Kurai, in their paper, titled “Analysis of the sale of payment operations in the supermarket using the quadratic theory,” analyze the queuing systems for the experimental data of the supermarket payment service unit using the quadratic theory. The main purpose of this paper is to examine the application of queuing theory and evaluation. Therefore, a mathematical model has been developed to analyze the performance of the service unit checking.
-
Tariq Ahmad and Vijay Prasad, in their paper, titled “Multi-server Math Analysis and Multiple Queue-Multi-Server Modeling Chart: Comparison Study,” derived from total cost assumptions.
Some of the cost of waiting in both cases proved that the total cost expected for the multi-server single server model is lower than the multi-server. Mathematically, its examples have been proven.
-
Anger Chouka Emanuel and Ozilura Chukomka and Patrick Oguchugo analyzed in their paper “Quadrature Analysis in an Organization (Case Study First Bank PLC, Nigeria)” and concluded that their number of servers was not sufficient for customer service. It was observed that instead of 3, now 5 servers are needed. This indicates the need to increase the number of servers to serve the customer better.
PROPOSED METHOD AND DISCUSSION
M/M/1 queuing model.
This means that arrival time and service are distributed equally (Poisson’s trend). To analyze the cash flow analysis system M/M/1 of the queuing model, the following variables will be examined:
-
λ: Average customer arrival rate
-
μ: Average service rate
-
Factor of use:

-
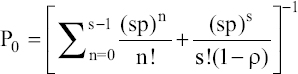
Zero probability of customers in the bank: P0 = 1−ρ
-
The probability of having a n customer in the bank: Pn = P0ρn
-
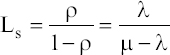
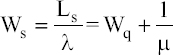
Average number of customers in the bank:
-
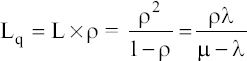
Average number of customers in the queue:
-
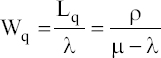
Average waiting time in the queue:
-
Average time spent on the bank including waiting time:
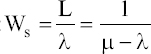
Model M/M/s Queue
-
λ: Average customer arrival rate
-
μ: Average service rate
-
Factor of use:

-
Zero probability of customers in the bank:
-
The probability of having a n customer in the bank: Pn = P0ρn
-
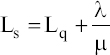
Average number of customers in the bank:
-
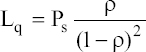
Average number of customers in the queue:
-
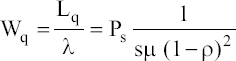
Average waiting time in the queue:
-
Average time spent on the bank including waiting time:
Theories
The data from this study were collected from the XYZ supermarket. The methods used in collecting data, direct observation and personal interviews and a questionnaire. Data were collected for 1 week.
-
A Poisson probability distribution with average customers λ per unit time;
-
According to each of the servers, there are no priority categories for each entry;
-
The service time is distributed seamlessly, with the average customer μ per unit time;
-
There are no finite number of queues (infinite);
-
Service providers work in full capacity;
-
The average entry rate is higher than the usual service rate;
-
Servers here are supermarket staff representatives;
-
The service rate is independent of the length of the line. Service providers are not quicker because the line is longe.
Figure 1 describes a single-step model with a single queue and several parallel servers. To do this, we will use the M/M/S queuing system.
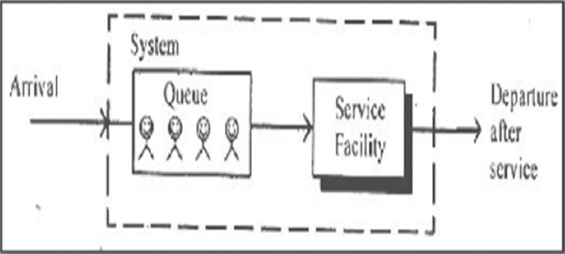
Figure 1: Model M/M/1 Queue
Figure 2 describes a single-step model with multiple queues and several parallel servers. To do this, we will use a M/M/1 queuing system.
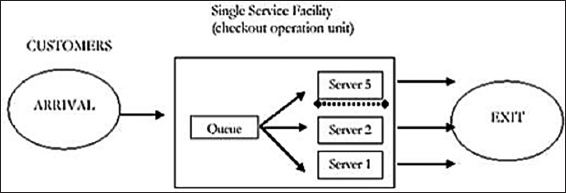
Figure 2: Singer stage queuing model with single-queue and multiple parallel servers
If we take into consideration a number of payment stands in the supermarket, the customer’s arrival rates and service rates for each station are payable, if we try to find values in two cases and compare all of these four attributes in each case. If there is only one queue, the system is considered as M/M/S.
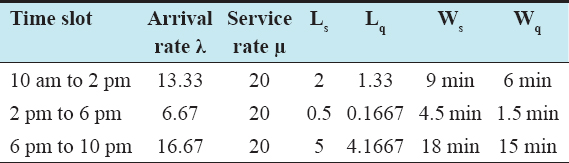
The following data were collected through questionnaires and surveys for the supermarket, which has 3 audit counterparts. Data are divided into three slots in the morning, arnoon, and night.
Expected total cost for M/M/1 and M/M/S models:
The service level has two opposite costs:
-
The cost of providing customer service
-
Delay in providing customer service.
Economic analysis of these costs helps management to manage the costs of service boosting, provide better services, and reduce customer due diligence.
Expected service cost E (SC) = sCs, where s is the number of servers and Cs is the cost of each service.[7]
Server
Expect waiting for the cost in the system = E(WC) = LsCw
The number of customers waiting in the system = Where Ls
Customer cost = And Cw
Data Analysis
Here, customers come to the queue. Data were collected for s += 3 audit counter. Therefore, there are 3 queues and customers choose their queue. In this case, customers go to the queue in each queue (zero queue behavior). The following calculations are queued using M/M/1 model performance metrics, having 3 separate payment monitors.
Expected cost estimate is assumed to be Rs. 200 service cost. Moreover, Rs. 250 expectancy expenditures per sample:

Proposed Model
There are 3 auditing counterparts, but there is only one queue and there is a device that indicates which queue the next client chooses. As soon as a meter is empty, it is shown on the car and the next customer joins that queue. The calculations are made using the M/M/S performance criteria of the queuing model.
s = 3 payment counter.
Expected total cost per single-queue multi-server model (e.g., model M/M/S).

CONCLUSION
In this paper, we conclude that the server is better than multi-server server. The waiting time for customers waiting for the queue is about 3 times lower than before. We also proved that the cost is expected to be lower than multi-server services over multiple multi-server services.