INTRODUCTION
Under the wave of regionalism[1]/slow and failure of trade negotiations at the multilateral level, India[2] like other developing countries has negotiated and signed various bilateral and regional trade agreements with great enthusiasm.[3] India wants to boost trade relation with its extended neighbor, i.e., Australia. Both are connected by 3C’s, i.e., curry, commonwealth, and cricket.[3] No doubt, both share many commonalities such as democracy, free press, independent judicial system, membership in Commonwealth, passion for the game of cricket and business interests and dissimilarities also such as diverse in size, economic and social development, geography, political system, language, and culture, but their relation continued to improve and became closer.
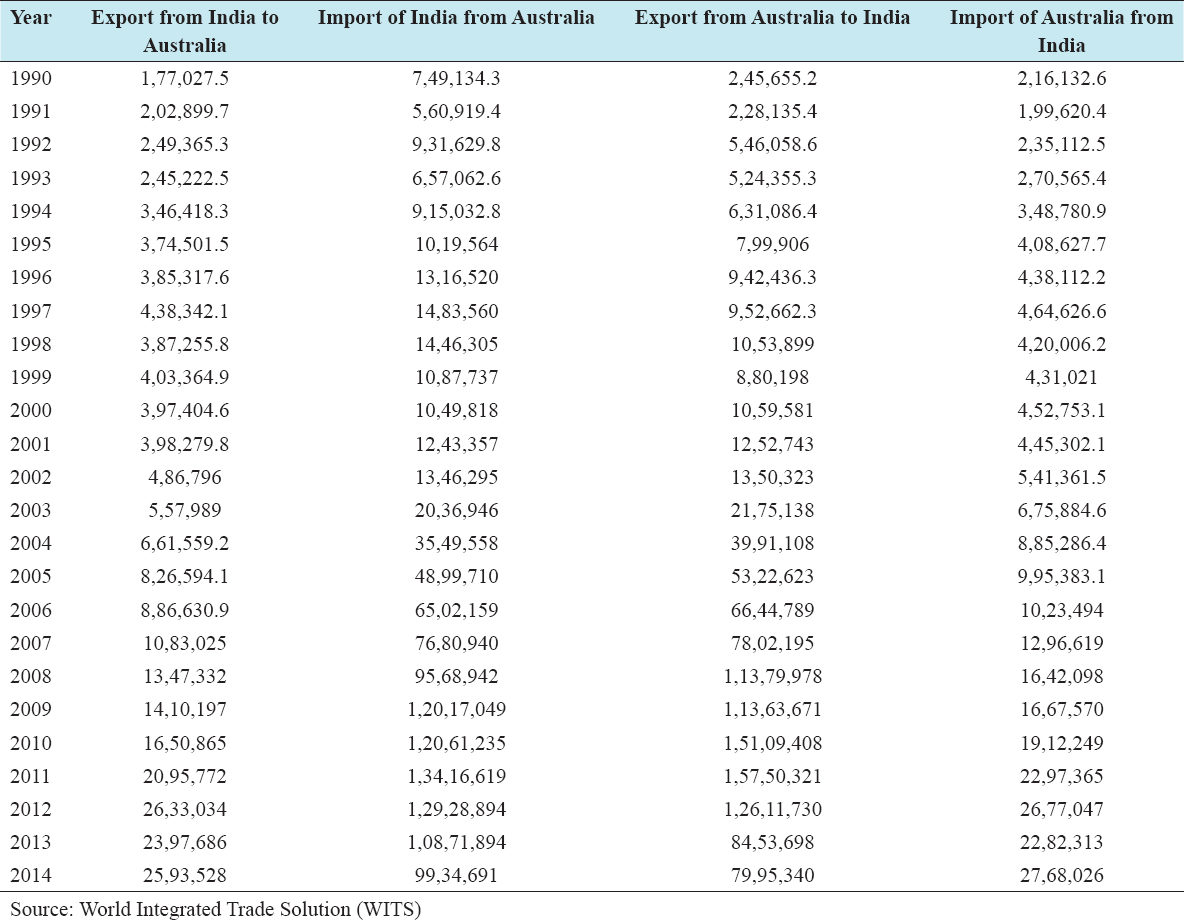
The relationship has achieved far from its potential. The economic relationship between them has developed rapidly in recent years, particularly under the impetus of economic reforms and regionalism. India has become the fifth largest trading partner of Australia. Bilateral trade continued to increase at increasing rate as seen from Table 1. India’s exports to Australia increased to US$ 25,93,528 thousand (2014) from US$ 1,77,027.5 thousand in 1990. Similarly imports also increased to US$ 99,34,691 thousand (2014) from US$ 7,49,134.3 thousand in 1990 [Table 1]. India has throughout imported substantially more from Australia than exported to it. However, percentage-wise share is very small but continued to increase. Major imports of India from Australia are mineral fuels, oils, distillation products, etc., pearls, precious stones, metals, coins, ores, slag and ash, edible vegetables and certain roots and tubers and Inorganic chemicals, and precious metal compound, isotopes. Similarly, India’s major exports to Australia are mineral fuels, oils, distillation products, etc., pearls, precious stones, metals, coins, etc., pharmaceutical products, vehicles other than railway, tramway and other made textiles articles, sets, worn clothing, etc.[4] Australia has become a significant trading partner of India, but its potential has yet to be exploited. To further promote the bilateral trade and economic cooperation, two biggest naval powers of the Indian Ocean have started to forge a comprehensive bilateral relationship, i.e., FTA in the coming decades.
Table 1: Bilateral trade between India and Australia (US$ thousand)
Objectives of the Study
-
To briefly explain India’s relation with Australia,
-
To identify the comparative advantage/trade specialization in the exports and imports for commodities, at 2-digit level, to explore potential areas for further cooperation and
-
To explore intensity of India’s trade with Australia.
India’s Relation with Australia: Historical Prospective
India and Australia trade link go back to the colonial period. India played a central role in nourishing the young colony, i.e., Australia and trade with it. Calcutta also came to the rescue of the new colony when in 1792 the Guardianship carrying food to Australia submerged leaving the colony without any food supplies. The Governor of Australia looked toward India for immediate help in dispatching the Atlantic to bring back all the food and stores it could carry. The Atlantic came back to Australia with a cargo of rice, wheat, and lentils. Likewise, Bengal received its first shipment of Australian coal in 1799, from Newcastle. In the first half of 19th century, as British bureaucrats, merchants, chaplains, and judges from the two colonies interacted directly; India became Australia’s first direct contact. The links began to grow further, and a ship was visiting India from Sydney nearly every 4 days by 1840. It brought prosperity to Indian merchants as they supplied food, spices Anglo-Indian furniture. Australia became a new settlement place for many British colonial families posted in India at the beginning the 19th century.
The recent trade links between India and Australia began during the post-independence period. When India became independent in 1947, Australia had a labor government that held power until 1949 and relations with India were close and sympathetic. At India’s invitation, two representatives from Australia came to India and participated at the 1947 Asia Relations Conference held in New Delhi. Their reports to the Australian government mentioned government differences on two critical issues, i.e., United Nations Security Council veto rights and treatment of newly defeated Japan and India’s concern at Australia’s restrictions on immigration. Their report led to produce little negativity in the relationship. From 1947-67, relations between these countries pivoted around the strong personalities of Prime Ministers Robert Menzies,[5] the Anglophile Empire loyalist and Jawaharlal Nehru,[6] the leader of struggles against colonialism in India and the Third World. Due to political and ideological dynamics and the varying perceptions of the Cold War politics, both the countries failed to establish any trade links. For decades due to clashes between two personalities, India decided to pursue a foreign policy of Non-alignment; this matched with Australia’s pact alliance with the United States (Sharma, 2016).
Until the 1980s, head of both the governments visited each other’s countries. After Prime Minister Rajiv Gandhi’s bilateral visit to Australia in 1986, there was no prime ministerial visit to Australia from the Indian side for almost three decades. However, other important minister, heads of the state and the Vice President of India visited Australia. However, the end of the Cold War cleared political and ideological divergences and India’s economic reforms in the 1990s began to change the perception of many Western developed countries about India. Since the liberalization and economic reforms began to unfold, India has progressed and is being recognized at the international stage for economic, military, and political considerations. A developing India offers immense opportunities to Australia that has got resources and expertise to offer that India needs. Australia too began to view India as the next big destination for the business and market. The enormous opportunities in Australia and India trade relations began to be noticed by both the nations.[3]
Over the past one and half decade, India’s economic growth, its appetite for resources, energy demand, skill development, technical know-how, and investment have made it an important trade partner and export destination for Australia. The two countries established a strategic partnership and have strengthened multi-level interactions and cooperation. There have been frequent high-level visits between the two countries’ leaders, with more than 10 ministerial visits annually. Since its inception in 2005, the foreign ministers’ annual dialog between the two countries has been held 7 times and played an important role in promoting and coordinating bilateral cooperation. In November 2009, Australian Prime Minister Kevin Rudd visited India, and the two sides upgraded their bilateral relationship to a strategic partnership.
To meet the needs of a rapidly developing bilateral relationship, India opened consulates in Melbourne and Perth in 2006 and 2011, respectively; Australia expanded its High Commission in New Delhi, upgraded its consulates in Chennai and Mumbai, and either opened or expanded trade representative offices in eight other Indian cities. In their two summit-level meetings last year, Prime Minister Narendra Modi and Prime Minister Tony Abbott decided to prioritize and enhanced the India-Australia relationship to a comprehensive level, i.e., signing of FTA. The political stability of the new government in India and the political will at the top level of Australian and Indian leadership augur well for a comprehensive relationship with expansion in the sectors which have yet to form a considerable chunk of Australia-India trade.
REVIEW OF LITERATURE
Ariff and Hill analyzed the growth and trade performance of ASEAN manufactured exports only, future prospects and structural changes in revealed comparative advantage (RCA), used trade intensity index (TII), and RCA. Balassa and Noland examined the changing pattern of trade specialization of Japan and the United States, applied Balassa index of RCA and net export index (NEI). Both countries have also increased their comparative advantage in high technology products overtime. Khwaja and Mahmood explored the prospects of trade expansion between ASEAN and SAARC countries, employed RCA, TII, and trade complementarity index (TCI). Bojnec analyzed the pattern and potential of regional and global agricultural trade flows, with special emphasis on EU-15, Asia, NAFTA, Africa, Caribbean, and Oceania, utilized intra-industry versus inter-industry trade with Grubel and Lloyd, RCA and international agricultural terms of trade. Utkulu and Seymen estimated competitiveness and the pattern of trade, trade specialization for Turkey to EU, embodied RCA Sikdar evaluated trade prospects, nature, structure, and viability of trade between two neighboring countries India and Bangladesh, using TII, RCA, and TCI.
Zhou et al. investigated the major trends and changes in the bilateral agricultural trade between Australia and China at disaggregate level and also calculated trade intensity, comparative advantage and trade complimentary between them to address the likely prospects of trade. Trade between them has been increased at increasing rate. It stated that both will trade greater than the expected level. Basu and Datta analyzed trend in comparative advantage, similarity, and complimentarity in trade and reasons behind persistent bilateral trade deficit of Bangladesh with India since its formation in 1971 applied RCA, cosine measure and GL indices for intra-industry trade. Both have trade specialization in unskilled labor-intensive products with RCA>1. Makochekanwa studied the pattern of trade specialization for Botswana that has undergone a structural shift between 1999 and 2004 due to openness and competitiveness in the world.
Boughanmi used a gravity model to investigate the trade potential of the Gulf Cooperation Council countries within the context of old and emerging preference trade arrangements in the region of Middle East and North African countries (19 countries). Akhtar et al. analyzed the trade pattern, trend, performance, and trade specialization in the footwear industry of Pakistan and compared it with China and India, Balassa index of RCA, both at 2-digit and 4-digit level of industrial classification for the time period 1996-2006. Chanda and Chaitanya analyzed the viability of a free trade agreement in goods between India and China, utilized RCA and TII. Bhattacharyya tried to quantify the extent to which India has a comparative advantage in the vegetable, fruit, and flower industries in the markets of Asian, EU, and North America (USA and Canada) as compared to South-East Asian countries.
Raghuramapatruni (2011) analyzed potential and prospects of trade within SAARC countries employed RCA and TII. Political conflicts between India and Pakistan should be settled as soon as possible because these two countries have great influence on other countries. Mehmood used Univariate autoregressive integrated model of model to forecast Pakistan’s export potential and prospects with seven members of SAARC over the next few years. Bano et al. the first to used TII and trade potential method to analyze trade prospects and potential between New Zealand and ASEAN countries for the period 1980-2010. The results of TII showed that there is considerable variation in export and import intensity index (III) between them, but expected to increase over time. These studies have analyzed particular country’s trade prospects with various countries individually and regional trading blocs by taking one commodity, utilized gravity model, augmented gravity model, Aquino Index, Grubel-Lloyd index, RCA, TII, and trade complimentarity index. No study has been carried to calculate India’s trade potential and prospects with Australia. It is in this context the present study attempt to make an effort in this direction.
MATERIALS AND METHODS
The secondary data have been used to attain the stated objectives. Data to calculate RCA, data have been collected at 2-digit level mentioned in standard international trade classification revision-2, United Nations Conference on Trade and Development (UNCTAD) database for the period 2001-2014. This data have been extracted from International Trade Centre (ITC) which is a joint agency of the WTO and the United Nations (www.trademap.org/Index.aspx). Data for India’s trade intensity with Australia have been collected (for the period 1990-2014) from various official sources, i.e., World Integrated Trade Solution (World Bank) (www.wits.worldbank.org/lang=en), Handbook of Statistics on the Indian Economy (Reserve Bank of India) (www.rbi.org.in), Direction of Trade Statistics (International Monetary Fund), Ministry of Commerce and Industry (Government of India), UNCTAD Handbook of Statistics (United Nations), UN Comtrade Database (United Nations Statistics Division), etc.
Methods
The present study calculated India’s trade prospects with Australia and the analytical tools/methods used for the study are as follows:
a. RCA: It tells about the relative trade performance of individual countries in particular commodities. It shows how competitive is a product in countries export compared to the products share in world trade. A product with high RCA is competitive and can be exported to countries with low RCA. Balassa’s formulation RCA for exports (RCAX) is calculated as below:
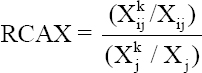
Where,
 = Export of product k by country i (India) to another Region/country j,
Xij = Total exports of country i (India) to the reference group j,
 = Exports of product k by the reference group j,
Xj = Total exports of reference group j.
The RCA for imports (RCAM) is calculated as below:
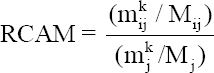
Where,
 = Import of product k by country i (India) from another Region/country j,
Mij = Total imports of country i (India) from the reference group j,
 = Imports of product k by the reference group j,
Mj = Total imports of reference group j.
b. TII: Trade potential of any country can primarily be measured with the help of Koijma (1964) TII with its partners. It tries to establish the relative trade performance of a trading partner in relation to a country’s trade with the rest of the world. When the trade intensity is high between two countries, it shows that both have more potential of trade with each other. It is defined as the share of one country’s exports (trade) going to a partner country divided by the share of world trade going to the partner. It is calculated as:
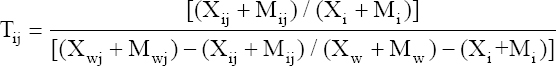
Where,
Tij = Total TII of country i with country j,
Xij = Exports of country i to country j,
Mij = Imports of country i from country j,
Xi = Total exports of country i,
Mi = Total imports of country i,
Xwj = Total world exports to country j,
Mwj = Total world imports from country j,
Xw = Total world exports,
Mw = Total world imports.
The calculation for the TII for exports is as follows:
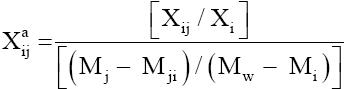
Where,
 = Export TII of country i with country j,
Xij = Exports of country i to country j,
Xi = Total exports of country i,
Mj = Total imports of country j,
Mji = Imports of country j from country i,
Mw = Total world imports,
Mi = Total imports of country i.
The calculation for the TII for imports is as follow:
Where,
 = Import TII of country i with country j,
Mij = Imports of country i from country j,
Mi = Total imports of country i,
Xj = Total exports of country j,
Xji = Exports of country j to country i,
Xw = Total world exports,
Xi = Total exports of country i.
RESULTS AND DISCUSSION
-
Results of RCAX
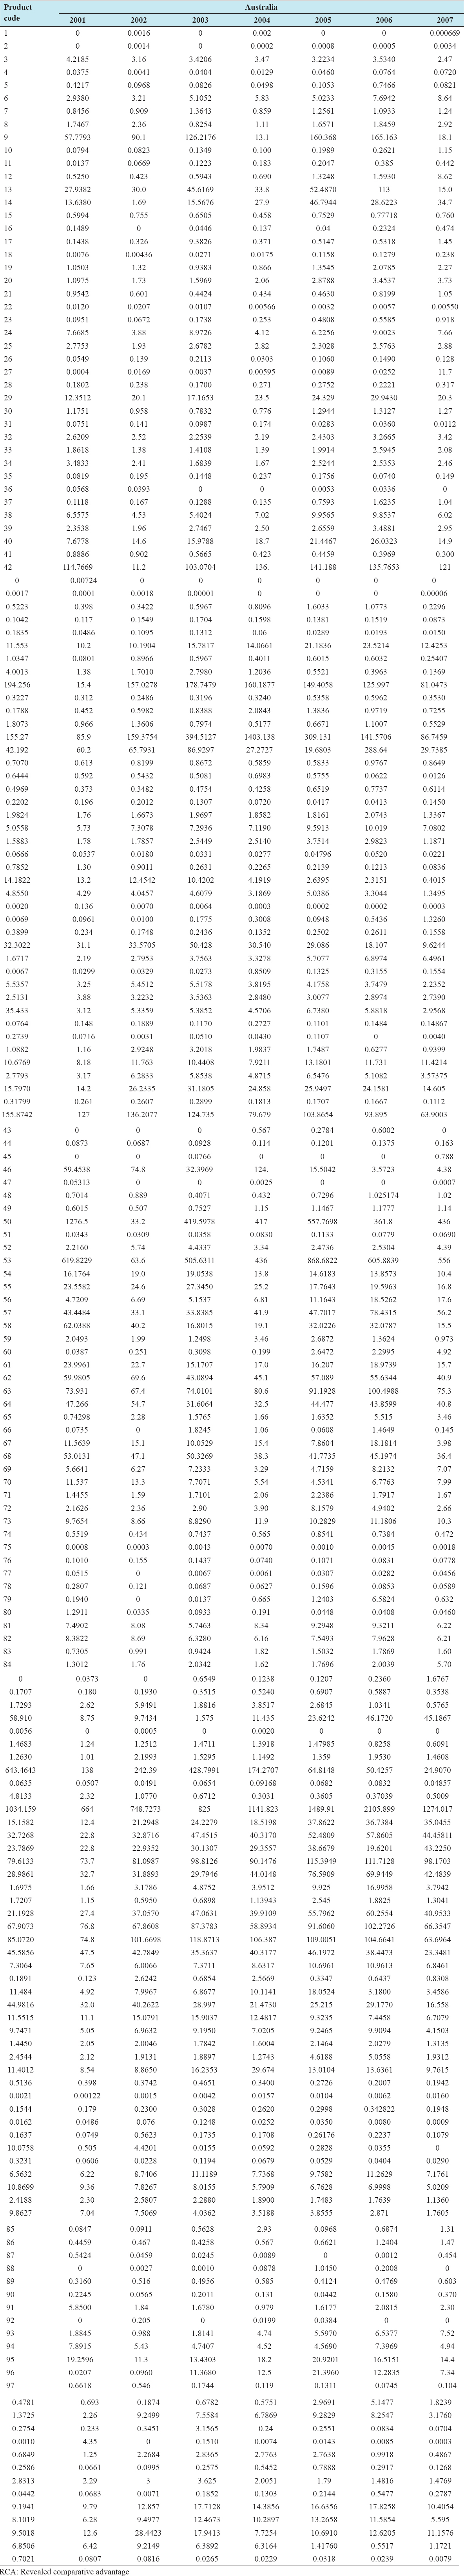
Table 2 summarizes the products which have a comparative advantage (RCA>1) in India’s export to Australia. Value >1 for RCAX indicates that India should export that particular product to Australia and vice versa.
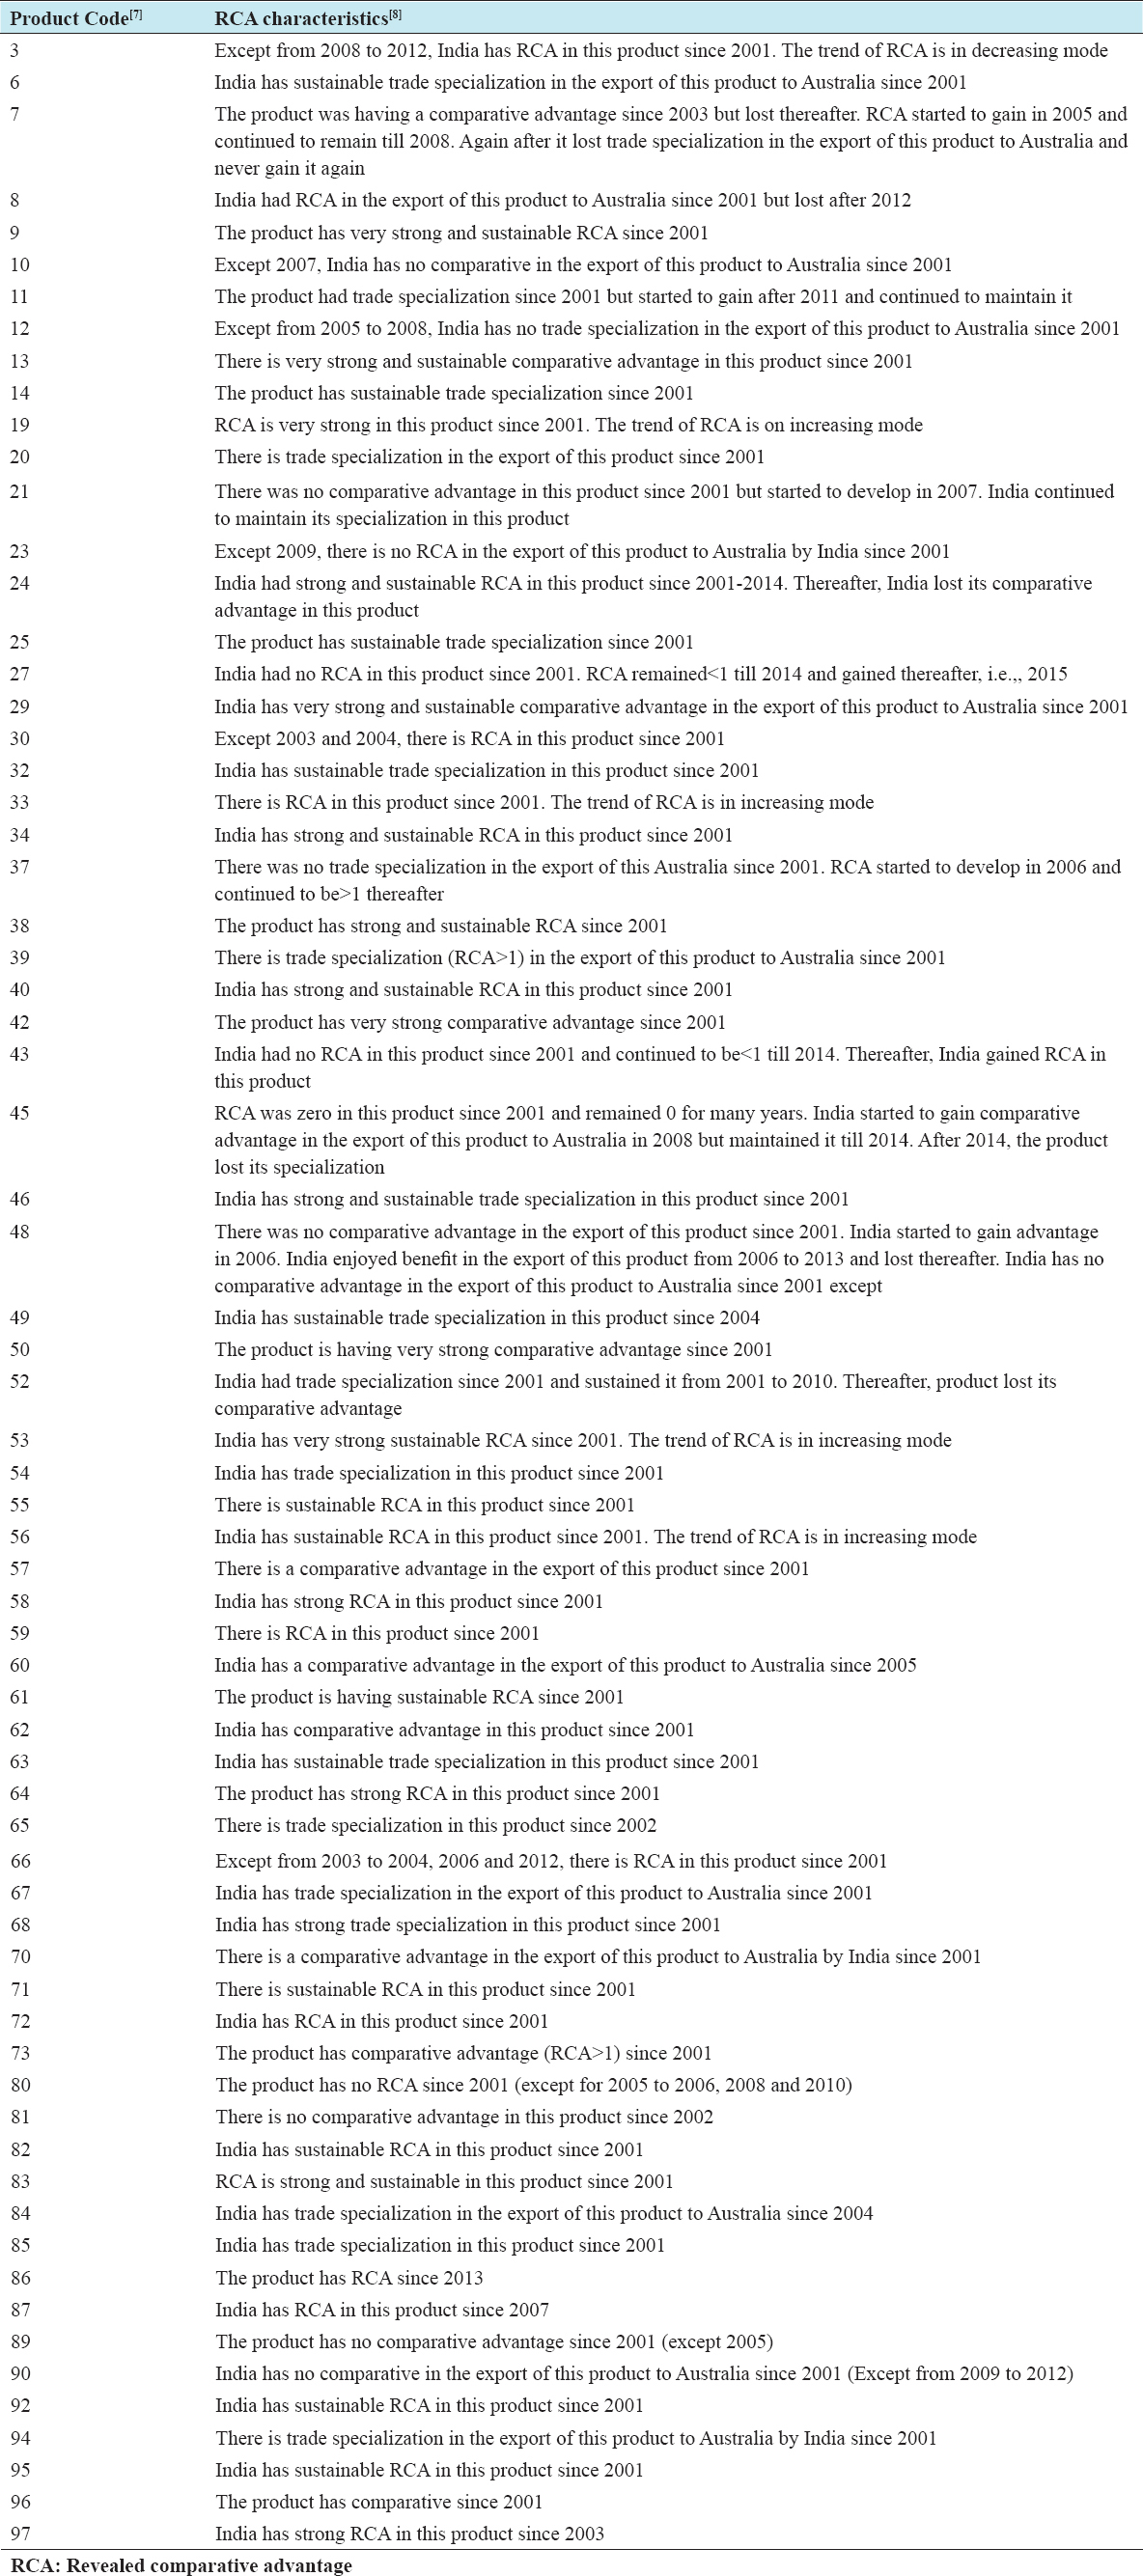
Table 2: Products with value of RCA>1 for exports to Australia by India
-
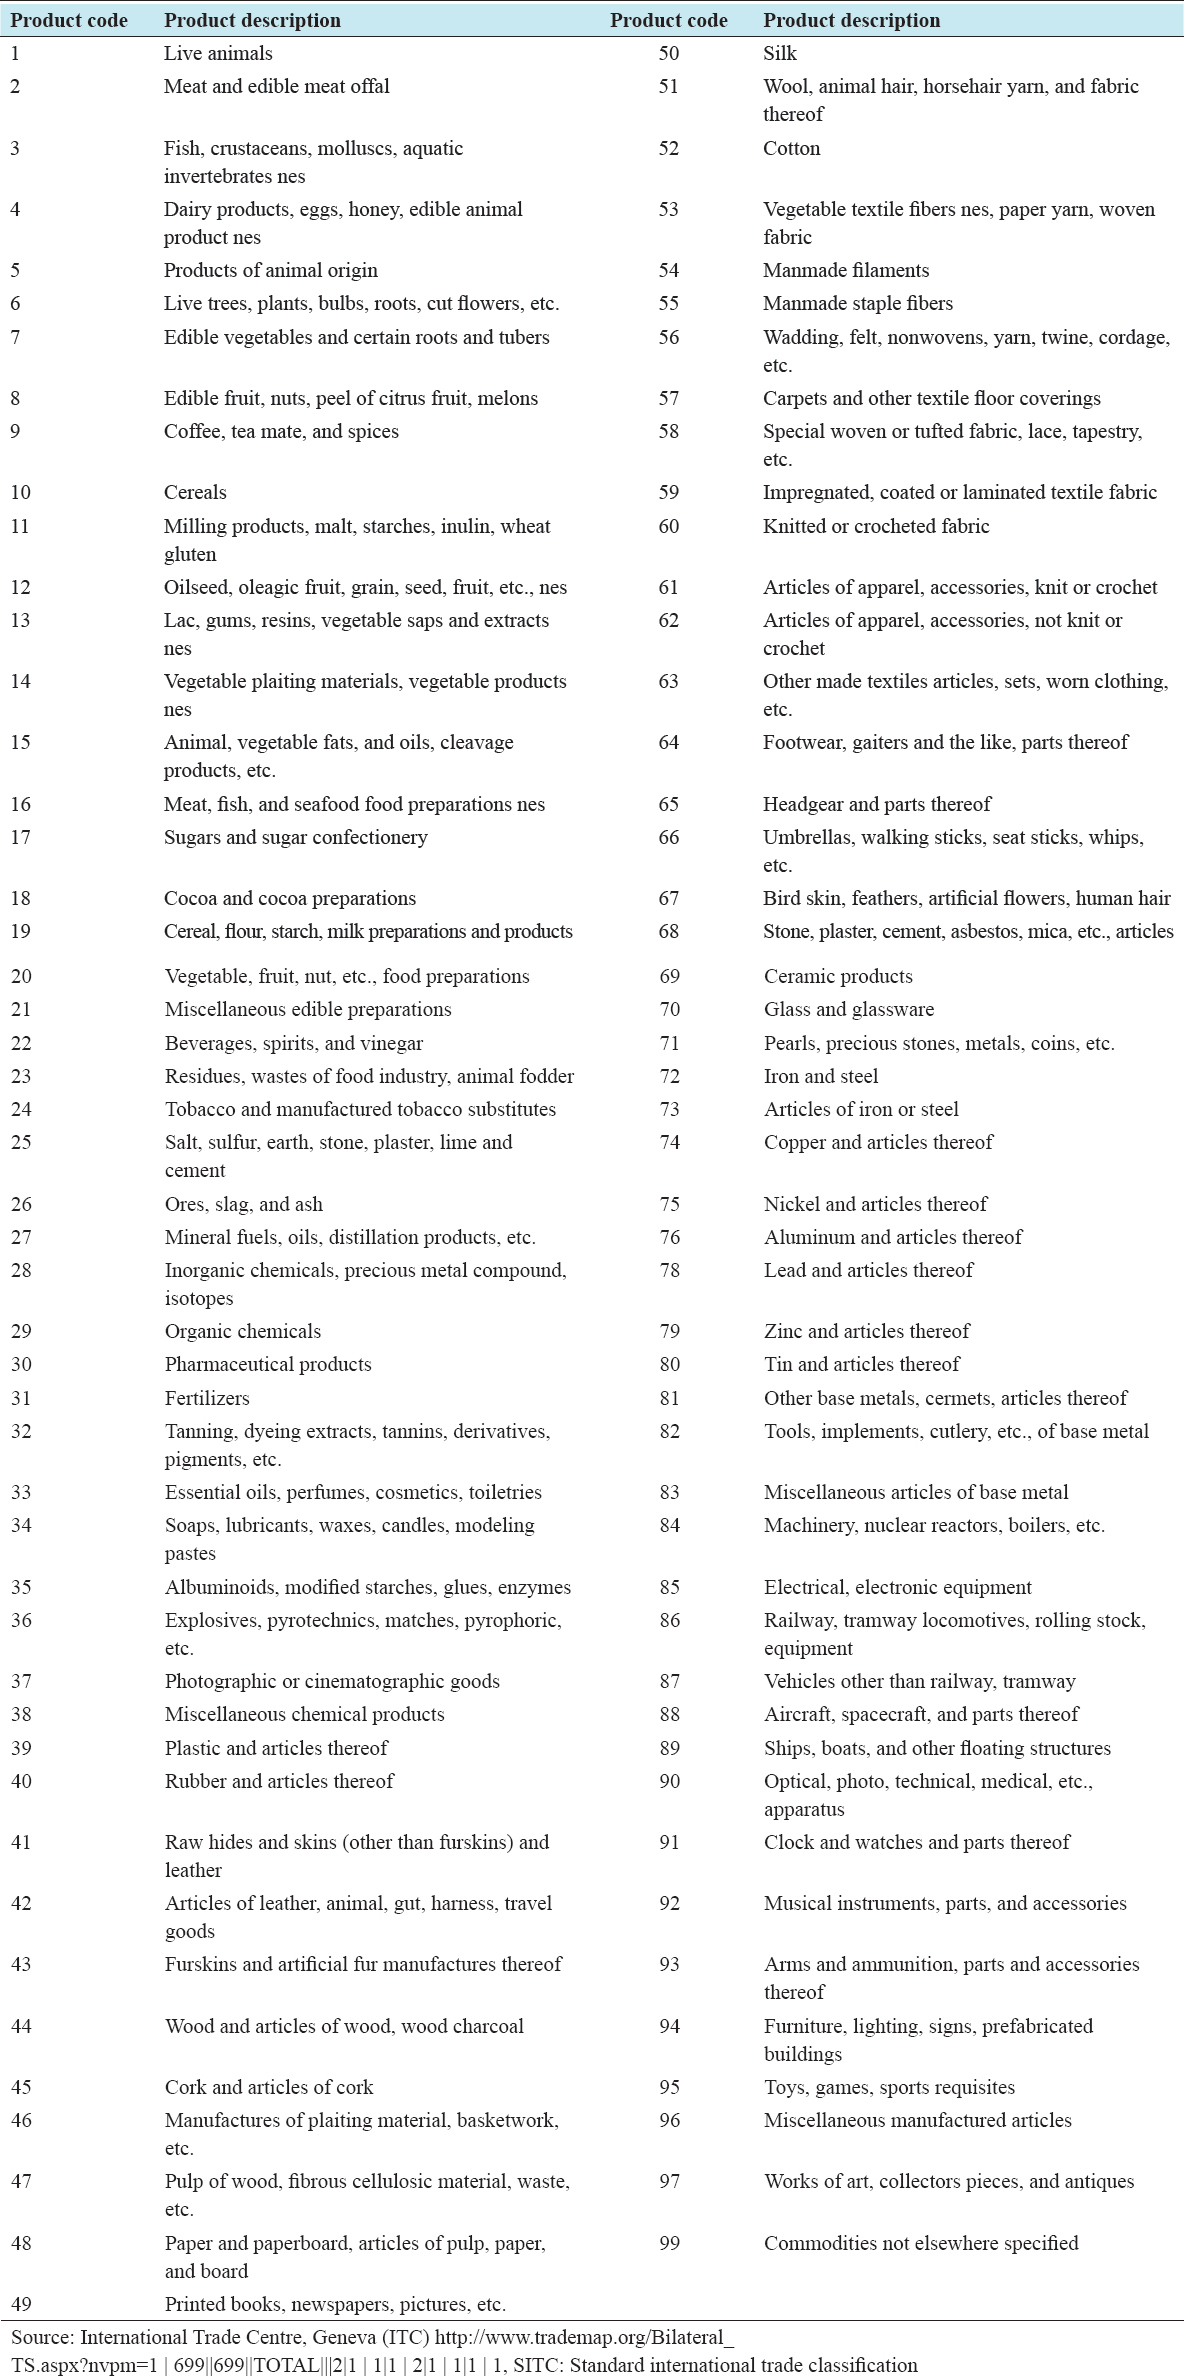
• As is seen from Table 2, India has sustainable RCA (RCA >1) in the export of products with code [Annexure 1] 3, 6, 9, 10, 13, 14, 19, 20, 23, 25, 29, 30, 32, 33, 34, 38, 39, 40, 42, 46, 49, 50, 53, 54, 55, 56, 57, 58, 59, 61, 62, 63, 64, 66, 67, 68, 69, 71, 72, 73, 82, 83, 85, 92, 94, and 95 to Australia since 2001 [Annexure 2].
-
• India has no trade specialization in products with code 7, 8, 24, 48, 52, 80, and 81, i.e., RCA is <1 as seen from Annexure 2.
-
• Products with code 11, 21, 27, 37, 43, 60, 84, 86, and 87 started to gain RCA in 2011, 2007, 2015, 2006, 2015, 2005, 2004, 2013, and 2007, respectively.
-
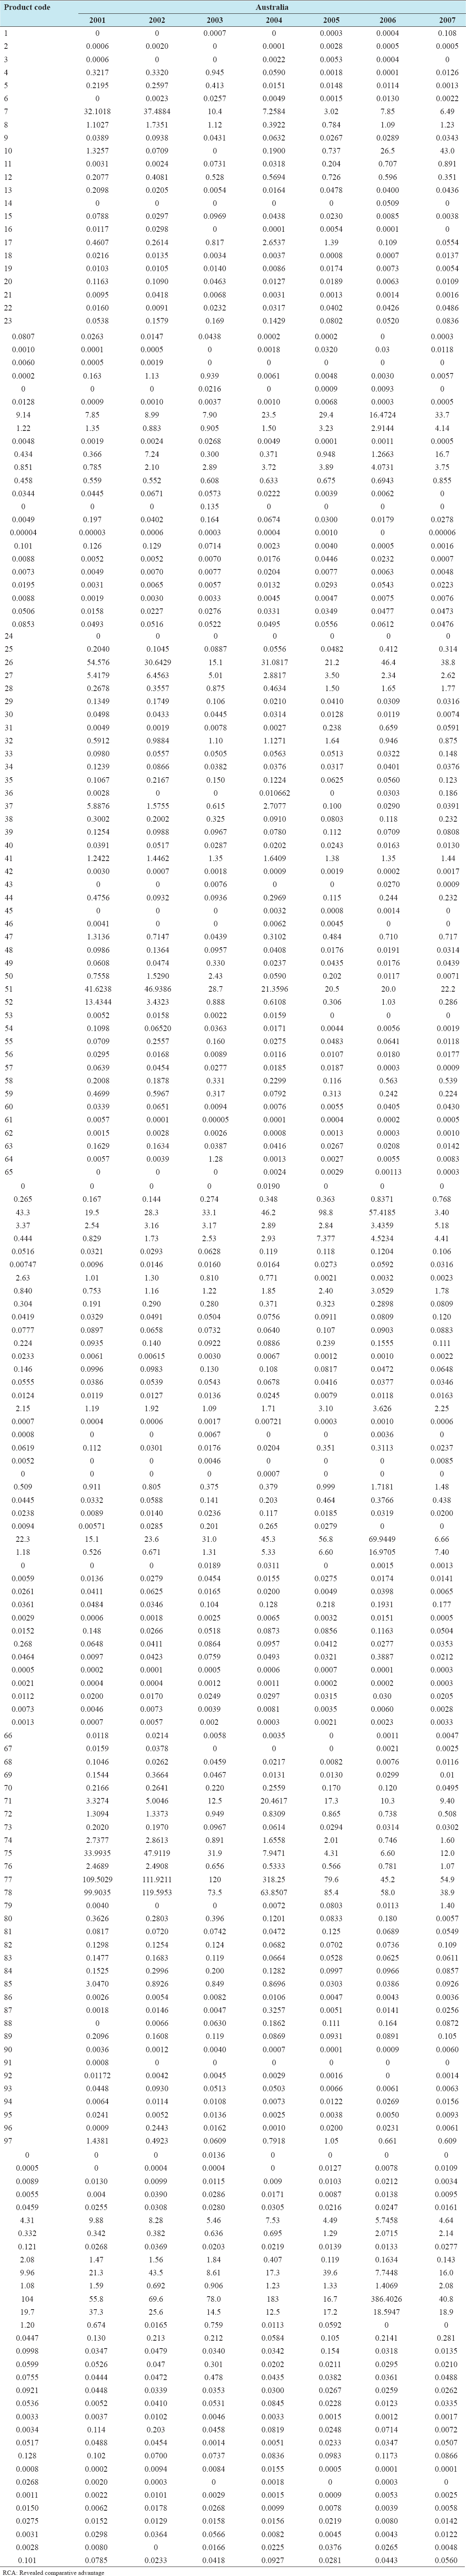
b. Results of RCAM
Table 3 summarizes products which have a comparative advantage (RCA >1) in India’s imports from Australia.
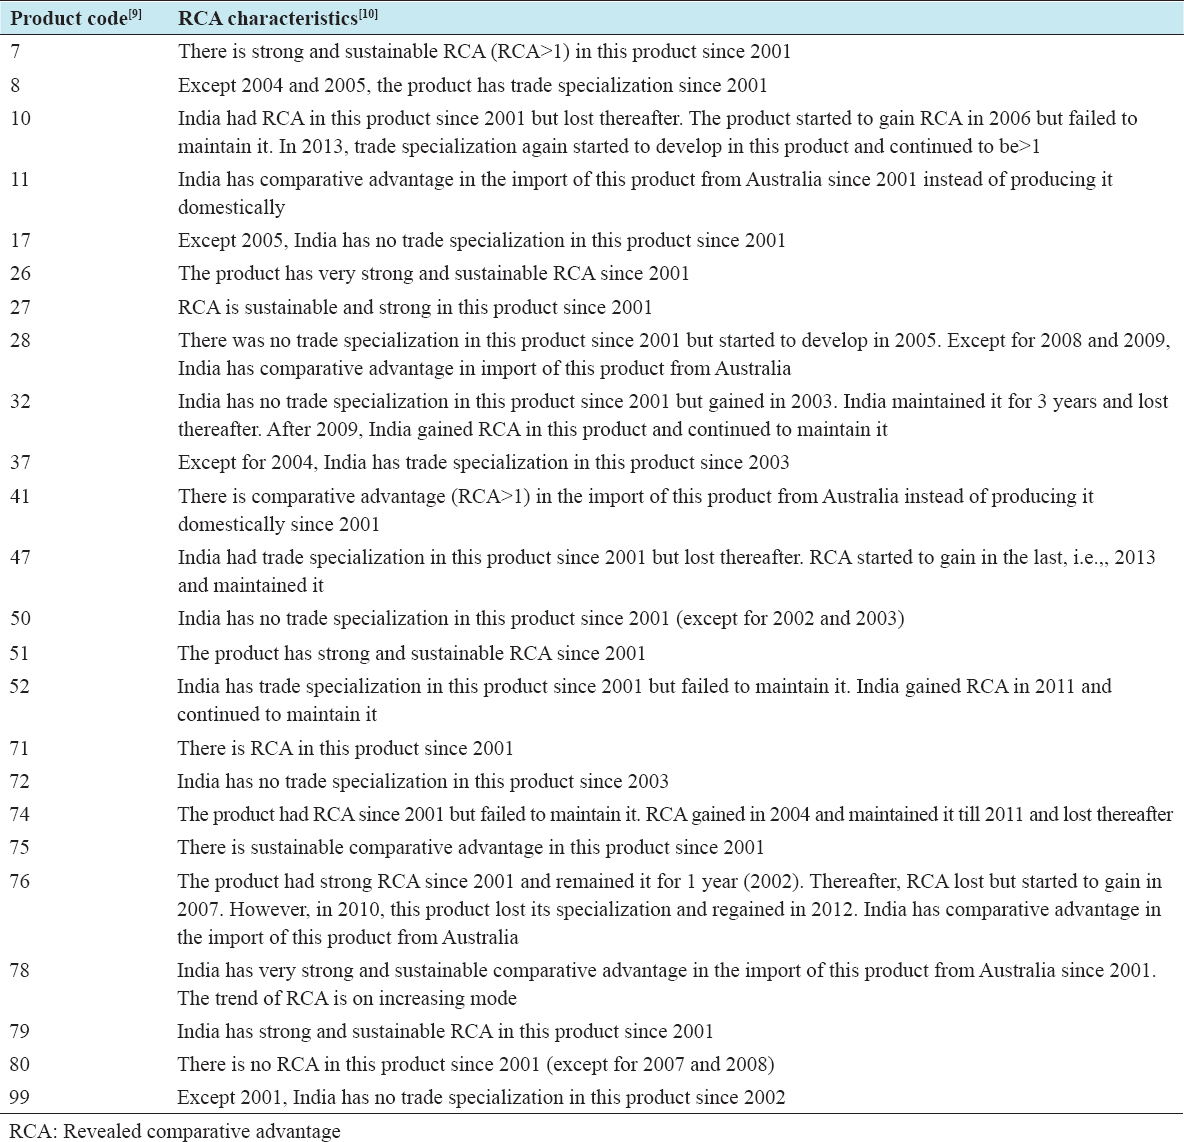
Table 3: Products with value of RCA>1 for imports by India from Australia
-
• As is seen from Table 3, India has no trade specialization in the imports of products with code 50, 72, 80, and 99 [Annexure 1] from Australia since 2001 [Annexure 3].
-
• India has a sustainable comparative advantage (RCA >1) in the imports of products with code 7, 8, 26, 27, 41, 47, 51, 52, 71, 75, 78, and 79 from Australia as seen from Annexure 3.
-
• Product with code 11, 28, and 32 had no RCA since 2001 but started to gain in 2009, 2005, and 2003, respectively [Annexure 3].
-
c. Results of TII
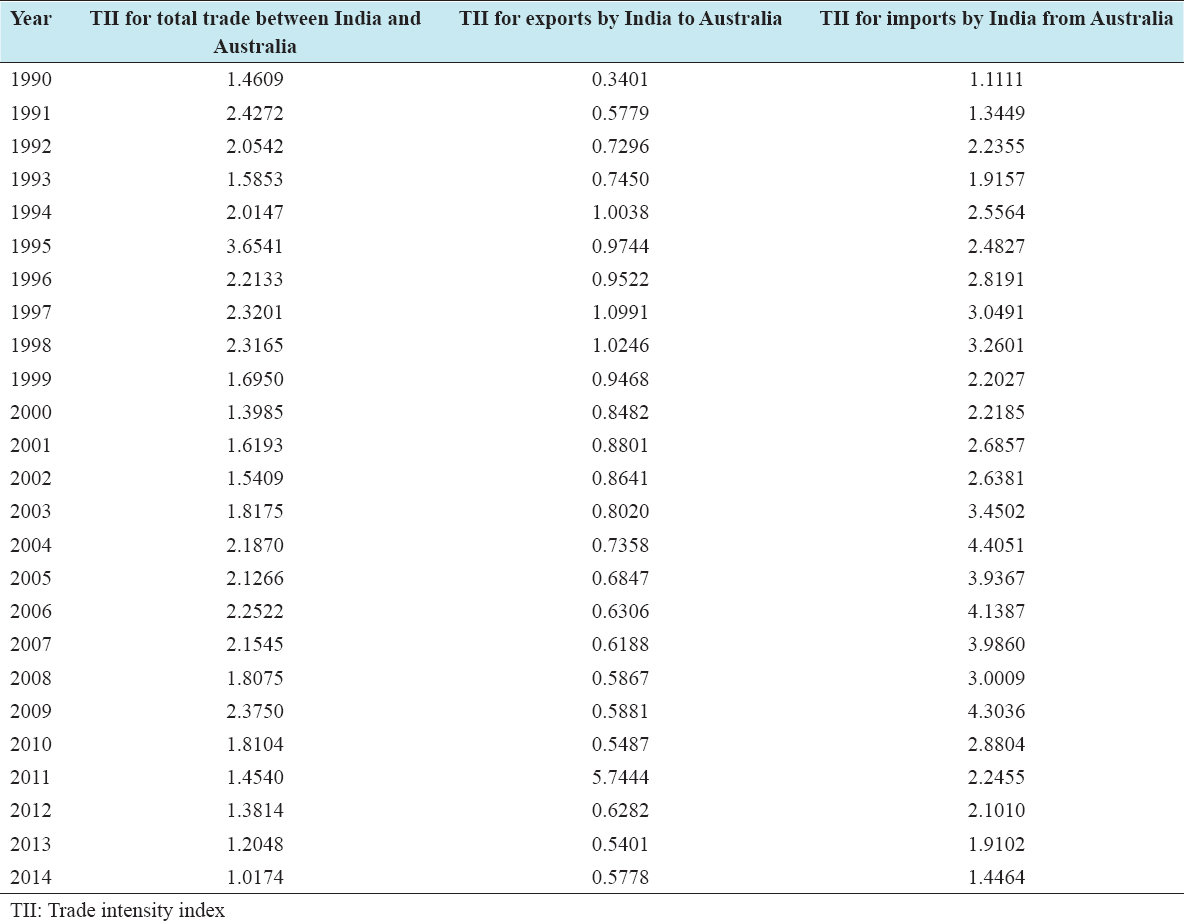
Intensity of trade index is used to find relative intensity of trade of India with Australia for total trade, exports from India to Australia and for imports by India from Australia. A unitary value, i.e., TII =1, shows that there is no difference in importance to a nation i in supplying imports to nation j. TII with a value >1 (TII >1) indicates higher bilateral trade that can be expected on the basis of their share in world trade. When the value of intensity is high between two countries, it shows that both have more potential of trade with each other.
As is seen from Table 4, there are fluctuations in total TII and III. Intensity of India trade with Australia for total trade and imports by India from it is >1 since 1990. Total TII is recorded highest in 1995. Except 1994, 1997, and 1998, India has no intensity of trade with for exports by India to it. India has sustainable trade prospects with Australia and is a net importer of it.
Table 4: Intensity of trade index of India with Australia
DISCUSSION
IndiX has sustainable comparative advantage (RCA >1) in the export of products Lac, gums, resins, vegetable saps, silk, textile fibres, paper yarn, woven fabric, wadding, carpets textile floor, knit or crochet, footwear, pearls, precious stones, metals, steel and iron, electronic equipment, musical instruments, furniture, lighting, toys, games, sports requisites salt, sulfur, stone, plaster, lime and cement, soaps, lubricants, waxes, candles, modeling pastes, etc., and edible vegetables, fruit, nuts, peel of citrus fruit, melons, wool, animal hair, horsehair yarn, cotton, pearls, precious stones, metals, coins, nickel and articles, lead and articles, zinc and articles, mineral fuels, oils, pulp of wood, fibrous cellulosic material, etc., from it. This comparative advantage helps not only to diversify product baskets but also lead to increase the volume of trade. Intensity of trade India with Australia for total and for imports from it is >1. India’s export intensity is <1 except 1994, 1997, and 1998. India has sustainable and strong potential and prospects with Australia. Australia is India’s major trading partner.[11-23]
CONCLUSION
India’s trade with Australia continued to increase with increasing rate. Percentage share of exports to Australia and imports from it increased, so it becomes relevant to analyze India’s trade prospects with Australia. From above discussion, it can be concluded that India has trade sustainable and strong potential and prospects with Australia due to have trade specialization in many products and high rate of intensity.
RESEARCH IMPLICATIONS AND POLICY IMPLICATIONS
India has to focus on such products in which it has comparative advantage and export to Australia. This will help both in increasing volumes and achieving diversification of trade with Australia. It will enlarge its market size and competitive in the product. India has to maintain its specialization in products which have RCA >1 but also have to develop comparative advantage in other products. Off late, some of the goods from secondary sector have been added in exports from India to Australia.
Limitation of the Study
As I calculated India’s trade prospects with Australia at 2-digit level from 1990 to 2015, similarly trade prospects can also be calculated at 4, 6, and 8 digit level.