INTRODUCTION
Rice (Oryza sativa L.) is a cereal grain, belonging to the family Poaceae. It is measured as an essential crop plant, a suitable and staple source of food, and model species for molecular studies. Asian rice is one of the world’s most oldest crop species which believed to have been domesticated for over 1000 years ago.[1] However, discussion on its origin remains contentious.[2] The rice has two main subspecies including indica and japonica that were separately and independently domesticated from the wild-type rice, Oryza rufipogon. This view was supported by the genetic differentiation analyses and phylogenetic studies. With genetically divergent and ecologically diverse cultivars from the indica and japonica rice subspecies, rice has posed a great challenge to the phylogenetic investigation and molecular evolution studies of crop species.[3,4]
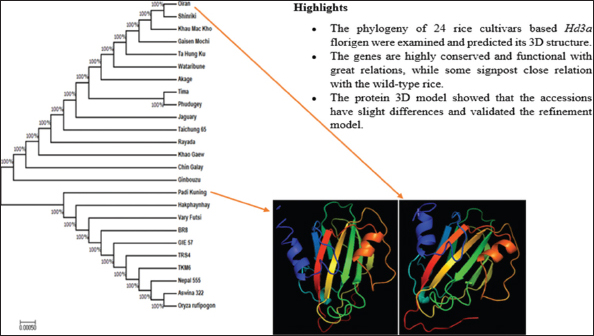
Interestingly, phylogenetic evidence suggested that the diverged genomic backgrounds of rice cultivars were derived individualistically from genetically distinct wild populations. The cereal spread to Madagascar from India and to East and West African nations. Furthermore, it was introduced to Greece and neighboring nations of Mediterranean. Mostly, the Mediterranean cultivated rice is japonica subspecies, while the ones grown at Indian subcontinent are indica subspecies. The indica cultivars have spread from Eastward to North China as well as Southeastern Asia.[5,6] Hence, determining the evolutionary relationship of the diverse cultivars using molecular phylogeny through bioinformatics approach remains an area to explore and it is of high significant value. Such analysis would help rice researchers toward choosing the right and relevant cultivars for domestication in each geographical location. In this study, we examine the molecular evolutionary relationships of 24 Asian rice cultivars using bioinformatics tools. This analysis was based on their established accessions for Heading date 3a (Hd3a) florigen. The gene is located on chromosome 6 and promotes flowering development in rice at short-day (SD) environment.[7] The gene is required for plant adaptation and domestication to different ecogeographical areas. Therefore, the present study would give an insight on the cultivars molecular relation, particularly, those from the same nation or region and also to give evidence for further research.
MATERIALS AND METHODS
Collection of Hd3a Gene Accessions
Different Hd3a accessions (amino acids sequences) were collected from the National Center for Biotechnology Information (NCBI) (http://www.ncbi.nlm.nih.gov/) GenBank for the analyses. The accessions include 12 indica and 12 japonica cultivars from different origin, precisely, part of the Asia continent. The indica cultivars are Padi Kuning (AB838400.1), Hakphaynhay (AB838397.1), Vary Futsi (AB838362.1), Chin Galay (AB838405.1), BR8 (AB838259.1), GIE 57 (AB838252.1), TRS4 (AB838250.1), TKM6 (AB838245.1), Khao Gaew (AB838262.1), Nepal 555 (AB838382.1), Rayada (AB838280.1), and Aswina 322 (AB838248.1), whereas japonica cultivars include Taichung65 (KR611196.1), Tima (AB838392.1), Jaguary (AB838387.1), Ginbouzu (AB838318.1), Wataribune (AB838310.1), Akage (AB838308.1), Phudugey (AB838269.1), Ta Hung Ku (AB838246.1), Gaisen Mochi (AB838296.1), Khau Mac Kho (AB564449.1), Oiran (AB838305.1), and Shinriki (AB838324.1), then, wild-type species as outgroup, O. rufipogon (AB838290.1). Different factors were considered before choosing the cultivars such as location, yield, and grain quality.
Molecular Evolution Analysis
The retrieved Hd3a amino acids sequences were analyzed using NCBI bioinformatics tools (http://www.ncbi.nlm.nih.gov/) and Swiss model. ClustalX was used for multiple sequence alignment to determine the proteins similarity, conserved region and non-conserved regions. Afterward, a phylogenetic tree was constructed by maximum likelihood method using Molecular Evolutionary Genetics Analysis (MEGA7) version 7.0.[8] The phylogenetic tree reliability was measured by bootstrap analysis.
Three-dimensional (3D) Structure Prediction and Model Validation
For 3D structure prediction of Hd3a protein, a single representative cultivar accession from each subspecies group was selected for the analysis. They include Oiran as japonica representative and Padi Kuning as indica representative. Before the 3D structure prediction, the secondary structure of the representatives was generated using protein homology/analogY Recognition Engine (PHYRE2) version 2.0 and analyzed. The 3D model of the two representatives was predicted and generated using I-TASSER server, as well as protein data bank (PDB) model. Several template models were generated and assessed for stereochemistry quality using RAMPAGE server for Ramachandran plot, ERRAT plot, and VERIFY 3D validation.
RESULTS AND DISCUSSION
Hd3a Sequence Analysis
In the present bioinformatics analysis, Hd3a a mobile flowering signal protein from different rice cultivars belonging to the two most widely studied rice subspecies was examined toward determining their phylogeny. To achieve that, 24 different established amino acids accessions (for the Hd3a; 12 from either indica and japonica subspecies) and a single outgroup were collected. All the accessions were retrieved from GenBank, comprehensively scrutinized the gene amino acids diversity and relationship to regional adaptation. The cultivars sequences considered in this study are from the higher and lower latitude regions of Asia due to their genome sequencing record. Figure 1 showed the multisequence alignment result. It indicated that the gene is highly conserved across all the accessions which agrees with the report of Molina, Sikora.[2] They demonstrated that indica and japonica subspecies of Asian rice were domesticated from either single or multiple wild types, O. rufipogon. The finding further elucidates on the gene functionality across the attested accessions.[9]
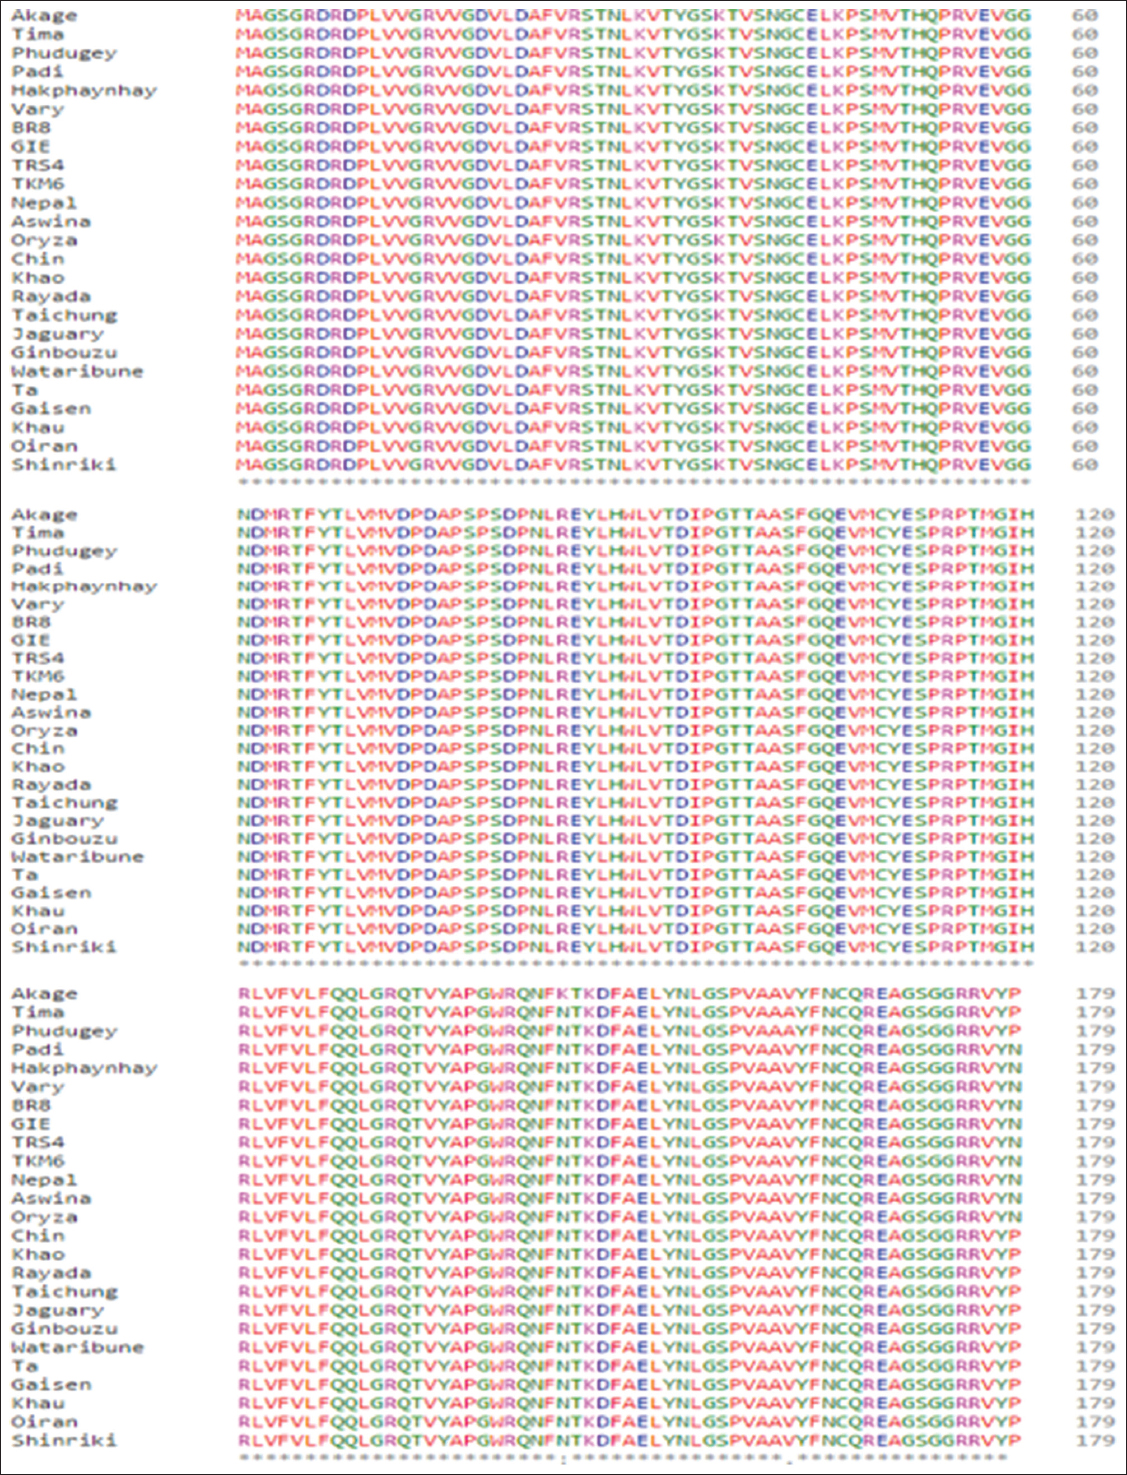
Figure 1: Multisequence alignment of Heading date 3a accessions from 24 Oryza sativa cultivars and Oryza rufipogon using clustalX. The amino acids are highly conserved as indicated with ground star
Functional flowering genes are required for plant adaptation to different ecogeographical location,[10,11] particularly, Hd3a florigen which encodes mobile signal protein molecules and triggers floral induction process in rice under SD condition.[7] It is the earlier discovered rice florigen activator which promotes flowering development, located on chromosome 6 of about 11.5 kb away from the second florigen, rice flowering locus T1. Hd3a gene plays a crucial role in species transition from vegetative to reproductive stage. It is produced in the leaf blades through the plant vascular system and interacts with 14-3-3 proteins that bridge interaction between the gene and bZIP transcription factor Oryza flowering locus D1 to reach the shoot apical meristem. The Hd3a-14-3-3 complex interaction occurred in the nucleus where its activate OsMADS15 transcription and switch-on the flowering processes. This mediated interaction is called florigen activation complex.[12,13]
Early heading date 1 and heading date (Hd1) are the two rice-specific regulators that regulate the florigen activations. The gene expression decreased under slightly more than 13 h photoperiod, i.e. long-day (LD) condition. Under LD condition, O. sativa gigantea receives light signals and effectively regulates the diurnal expression of Hd1 which results in Hd3a suppression.[14] As we earlier reported, a diverse number of pathways led to Hd3a transcription activation and repression.[15,16]
Phylogeny of Hd3a Florigen from Different Rice Cultivars
The cultivars Hd3a accessions phylogenetic tree was constructed using MEGA7[8] by maximum likelihood method (Li et al., 2017). The 24 O. sativa accessions plus a single out group of species O. rufipogon in the data sets were analyzed with all positions, and their relationship was presented in an unrooted cladogram tree as shown in Figure 2. The aim was to investigate the evolutionary relationships between the accessions. The tree was classified into two main groups: The first group comprises 15 accessions and the second group makes 10 accessions including outgroup as further described below.
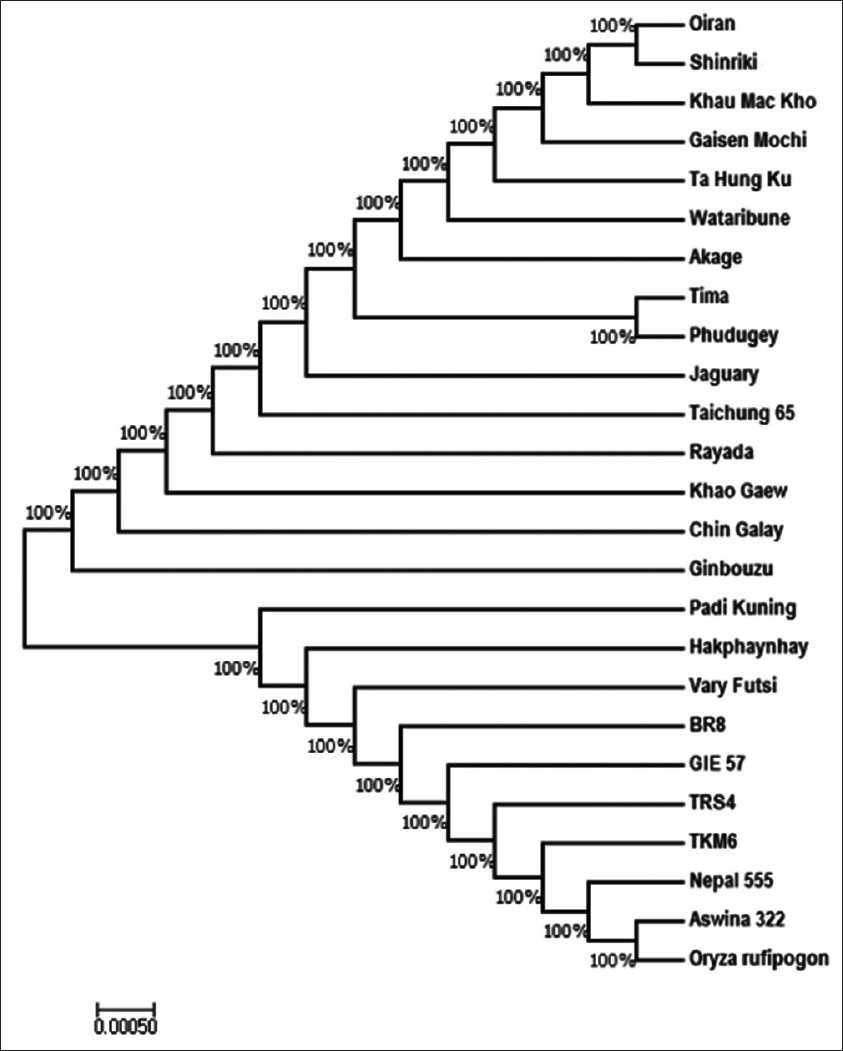
Figure 2: A phylogenetic tree of Heading date 3a accessions of japonica and indica cultivars of Oryza sativa plus Oryza rufipogon, a wild-type species (as outgroup) generated using molecular evolutionary genetics analysis 7
In the first main group, two subgroups emerged as follows: (a) 12 japonicas and 3 indicas, while (b) comprised only Ginbouzu (japonica). From the former subgroup, the cultivars were branched into clades, subclades, and cluster. Oiran and Shinkiri appeared in the same cluster, then, Tima and Phudugey also form a separate cluster with 100% similarity. Those cultivars are all belonging to japonica rice, and hence, these indicate their optimum molecular relationship based on the gene sequence. The two individual clusters indicate analogous sequence physiognomies (amino acids homology). In addition, the first cluster formed a subclade with other japonicas such as Khau Mac Kho, Gaisen Mochi, Ta Hung Ku, and Wataribune, then appeared in the same clade with Akage (japonica). On the other clade of this first subgroup, Jaguary and Taichung 65 appeared (japonica). Interestingly, Rayada, Khao Gaew, and Chin Galay of indica class appeared in the same clade of mostly japonica cultivars [Figure 2]. The presence of indicas within japonicas is due to amino acids similarity, differences or phylogeny from the other indica accessions. Furthermore, it may be due to character similarities such as ecosystem, evolution, anatomy, or physiology.[4]
Padi Kuning appears in a separate clade with other cultivars Hd3a but with close relationship with Hakphaynhay. On the other part of the tree subclade, Vary Futsi, BR8, GIE 57, TRS4, TKM6, and Nepal 555 showed a close association. Although the previous ones are having a closer relationship based on their appearance on the subclade branch. The single cluster from this group comprised Aswina 322 and O. rufipogon [Figure 2]. Consequently, the result implied that indica cultivars shared common evolutionary ancestors with the wild type which makes them form a major group. The appearance of wild-type species in the same cluster with Aswira clarifies on their domestication history. This corresponds with the finding of Molina, Sikora,[2] which indicated that Asian rice cultivars were domesticated from wild-type species, O. rufipogon.
In molecular evolutionary study, cladogram tree construction is of supreme important as its functions in inferring and elucidating developmental relationship among studied cultivars or species. The cladogram constructed in this study has shown the consensus phylogenetic tree of 24 O. sativa cultivars with a retention index of 1 and consistency index of 1 which signposts that there is no homoplasy and the character is stable with phylogeny.[17] Importantly, the study findings gave a better insight with regard to the evolutionary relationship among the aligned accessions. The sequence alignment and the phylogenetic tree are of utmost importance in molecular evolutionary relationship determination, particularly, rice species which has numerous cultivars. Phylogeny study functions in clarifying and deducing the evolution/origin of species being studied as earlier reported by Ge et al.[18] The authors demonstrate that specific gene evolutionary analysis through phylogeny would determine the species origin and also gave insight on its relationship with other species, subspecies, or cultivars. In this study, we determine the degree of molecular evolutionary relationship of the verified indica and japonica cultivars based on their most conserved flowering gene, Hd3a. Thus, this finding was supported by distinct phenotypic characteristics of rice subspecies, for example, indica rice are long grains in size and appears slender, while japonicas are short and stumpy.[19]
Hd3a 3D Structure Prediction and Validation of Refinement models
A representative of each subspecies group was selected for the secondary and 3D structure prediction. Oiran and Padi Kuning as japonica and indica representative were carefully chosen after the phylogenic tree analysis. The japonica representative was based on its higher similarity with other cultivars from the same subspecies which gives the cultivar advantage to make cluster at 100%, whereas the indica representative produced a separate clade with other cultivars Hd3a gene. Substantially, maximum and minimum evolutionary relationship was considered before the analysis. First, the florigen secondary structures were generated using PHYRE2 from the amino acids sequence (primary structure). The structures such as α-helix, β-sheet, and loops were observed. The secondary structures of the two representatives are highly similar. Oiran contains a total of 3 α-helix, while Padi Kuning possesses 4 α-helix. On the other secondary features, the two representatives are having a similar number of β-sheet and long loops.
I-TASSER server for protein prediction was used to predict the 3D model of the protein. Using the I-TASSER server, similar molecular structures between the florigen accessions were observed as in case of secondary prediction. The model prediction indicates high secondary structure similarity in terms of α-helix, β-sheet, and loops [Figure 3]. Therefore, PDB-format of the 3D predicted model was used for quality analysis and determined by C-score value.[20] The C-score value of 0.81 was obtained which indicates high confidence level on the structure model. The I-TASSER server used for the 3D generation is an integrated platform for automated protein structure prediction and function based on sequence-to-structure to function paradigm.[20] The server was ranked as the best approach for predicting protein structure in the past two CASP experiments. From the 3D model, the server equally dictates the protein-protein or proteins-ligands interaction based on the biological function of the molecules. Hence, one of the most common motivations for protein structure prediction is to use the structural information to gain insight into the protein’s biological activities.
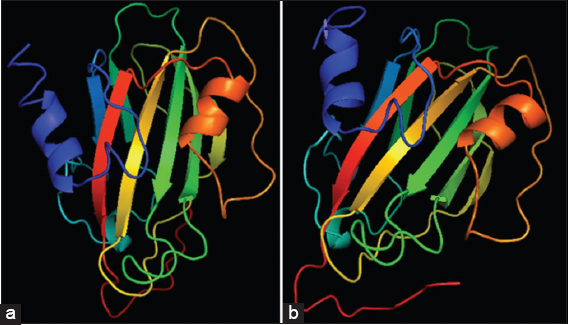
Figure 3: Heading date 3a predicted three-dimensional model of (a) Padi Kuning; indica representative and (b) Oiran; japonica representative
Subsequent to the modeling, the 3D structures were validated for the correctness of the overall fold and structure, error over localized regions, and stereochemical parameters such as angles, geometries, and bond lengths. ERRAT plot, Ramachandran plot, and VERIFY 3D validation tools were used for evaluating the 3D model of the representative accessions. The refinements model quality percentages were tabulated in Table 1 and the Ramachandran plot of the predicted models are shown in Figure 4a and b, respectively. From the plot, each residue in the protein is represented by a dotted black or another mark. Its model refinement quality was 96.20% of favored residues, 2.5% in the allowed region, and 0.6% outlier region. Ramachandran and Ramakrishnan[21] reported that the presence of 80–90% of residues “favored region” (core region) and the remaining residues in the “additional allowed” region such indicates that the generated model has a well-refined structure. Moreover, above 90% favored regions in the model are considered as a high-quality model.
Table 1: Comparison of refinement software for validation of RFT1 protein 3D model
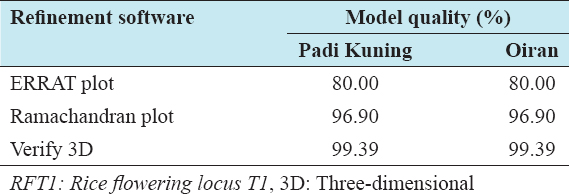
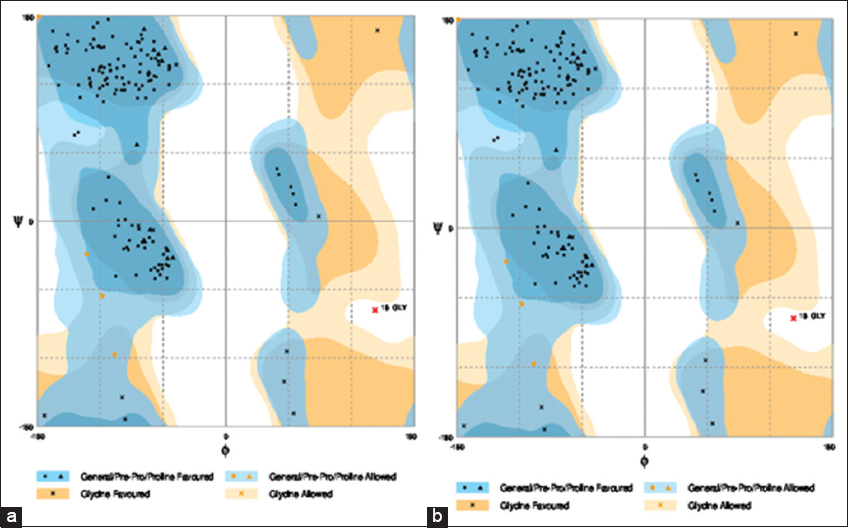
Figure 4: The three-dimensional structure validation of refinement model using Ramachandran plot (a) Padi kuning and (b) Oiran
Ramachandran plot is consisting of dihedral angles ψ (Y-axis) against φ (X-axis) of amino acid residues in protein structure. It shows the possible conformation of ψ and φ angles for a polypeptide larger side chains which resulted in more restrictions than a smaller region. The angles and the residue are greatly restricted by steric repulsion, while ERRAT plot model refinement is a protein structure verification based on algorithm. The ERRAT plot evaluates the progress of crystallographic model building and refinement. ERRAT also considers the distributions of non-bonded atoms according to atom type, distance, and energy strain method. The program equally has the ability to compare result for individual amino acid in the protein. A single output plot represents the value of the error function versus position of a 9-residue sliding window. To the best of our knowledge, the present research was the first to predict the 3D model for Hd3a protein from established sequences, as well as its validation. Therefore, the molecular evolutionary analysis of the cultivar accessions based on phylogenetic tree and prediction of the 3D model could assist in understanding the molecular function of the florigen, flowering development pathway, and mechanism and encourage further research such as quantitative trait loci analysis and genetic transformation.
CONCLUSION
Hd3a is the first discovered rice flowering gene which promotes the flowering development at SD condition through a series and complex mechanism. The gene was found to be highly conserved and functional but suppressed at slightly above 12 h day long. The florigen sequence analysis and accessions phylogeny were significant toward determining the molecular relationship of the rice cultivars grown in different part of the world, particularly Asia. Evenly, the 3D model prediction would assist in understanding the molecular function of the gene, activation, and suppression mechanism pathways and inspire further research which was all determine in this study. However, lack of such information may cause confusion toward choosing the right and related cultivars in each geographical location. In this research, the florigen was discovered to be highly conserved, and cultivars were interrelated based on evolutionary analysis and diverge across the subspecies. The predicted 3D structures were fine enough with a maximum refinement quality of 99.39%. Still, further laboratory analyses on the florigen impact toward an expansion of the rice cultivation areas and its partnering proteins need to carry out.