large

Effects of forest fire on tree species diversity in olokemeji Forest Reserve, Ogun State

A. J. Oloketuyi1, A. F. Ibimilua2, O. D. Akinyemi1*, O.J. Oyelowo1, O. R. Olatidoye1

1Department of Forest Conservation and Protection, Forestry Research Institute of Nigeria, PMB. 5054, Jericho, Ibadan, Nigeria; 2Department of Geography and Planning Science, Ekiti State University, Ado Ekiti, Nigeria

Address for correspondence: O. D. Akinyemi, Department of Forest Conservation and Protection, Forestry Research Institute of Nigeria, PMB. 5054, Jericho, Ibadan, Nigeria. E-mail: akinoloketuyi@gmail.com
Submitted: 07-06-2020, Accepted: 30-06-2020, Published: 30-07-2020

ABSTRACT

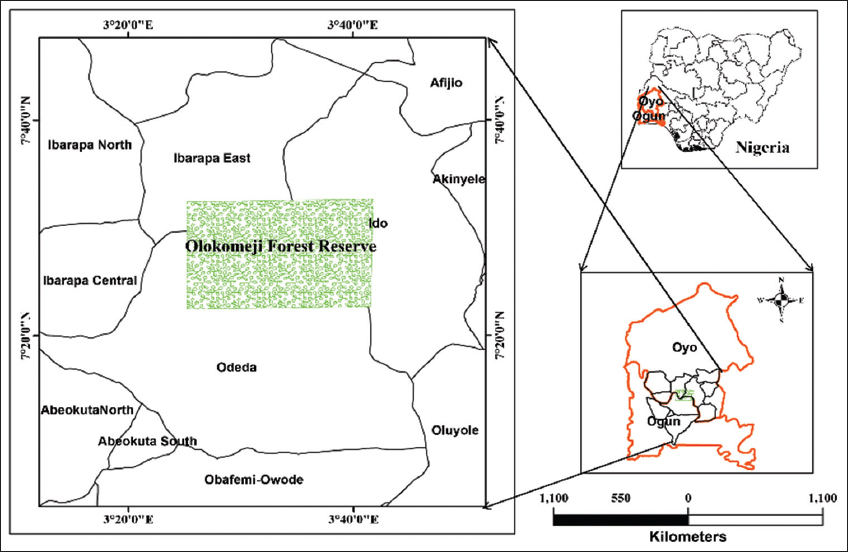
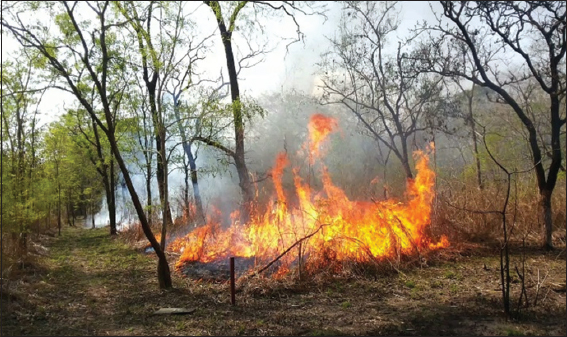
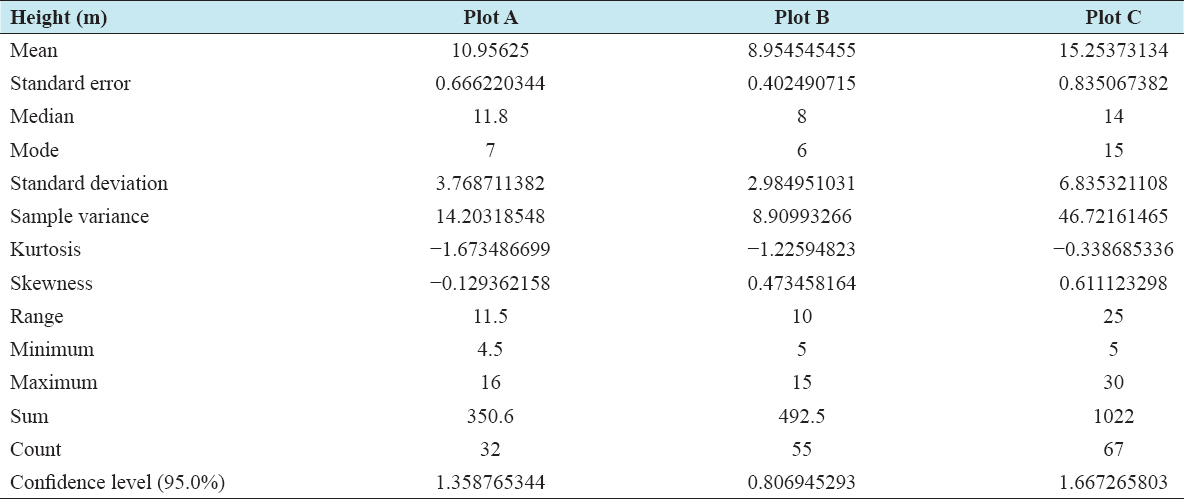
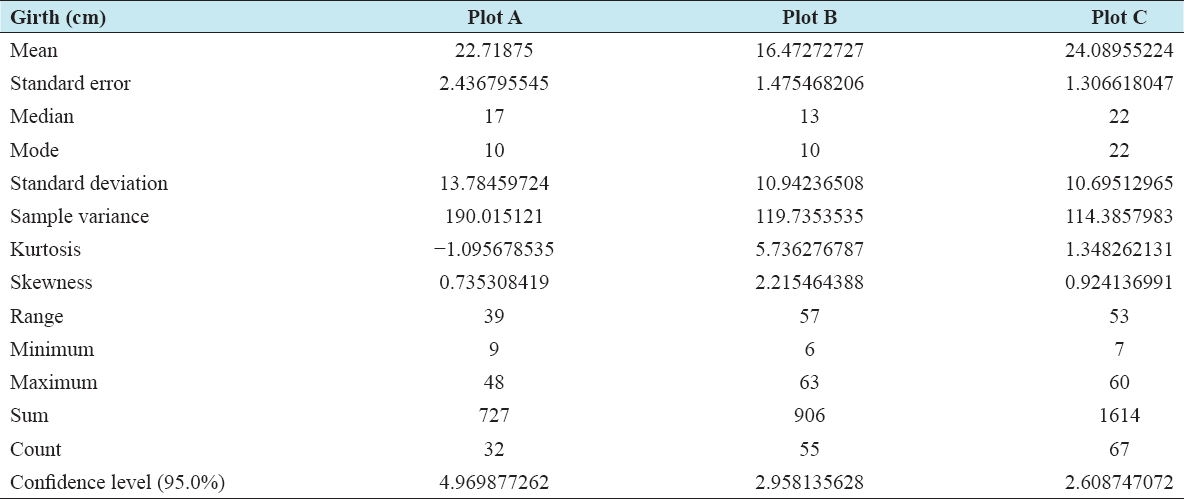
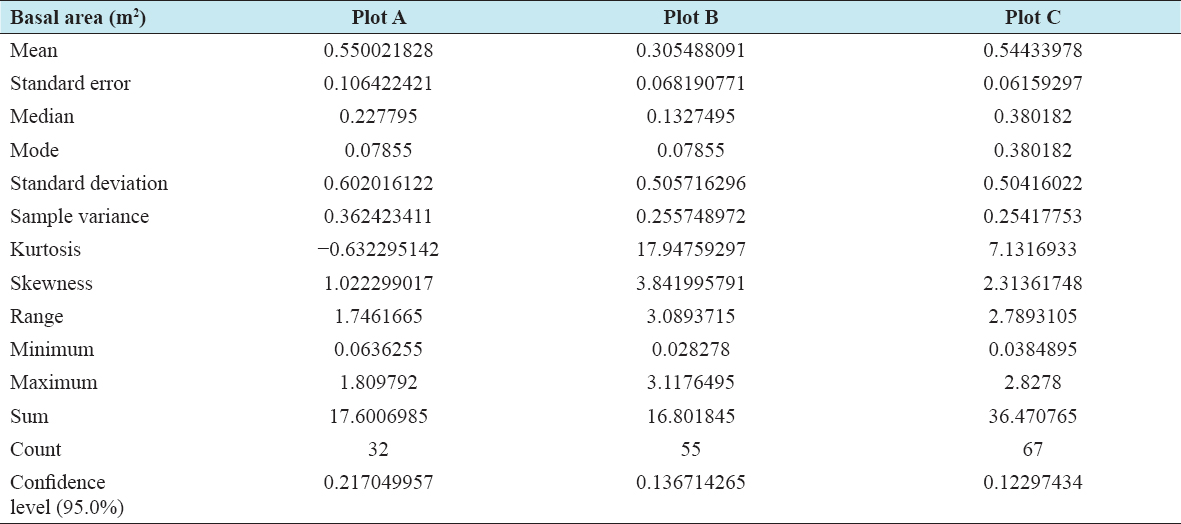
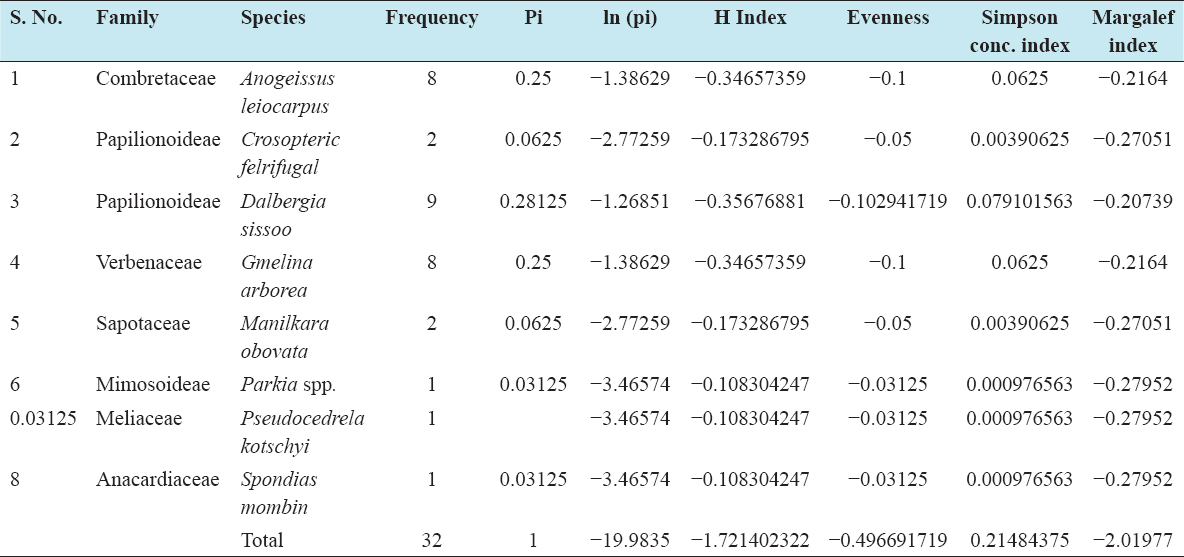
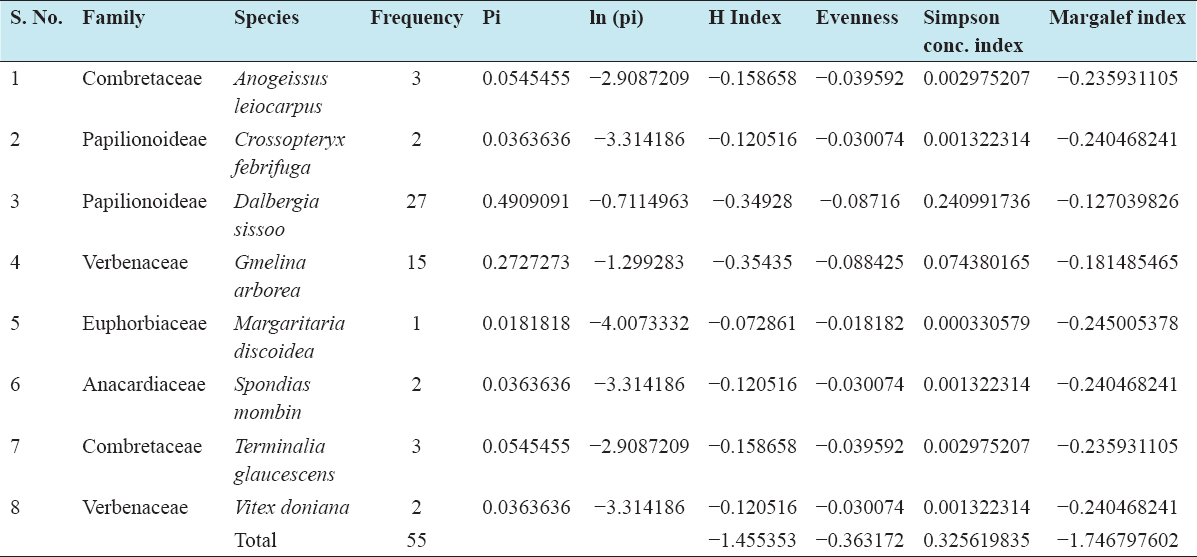
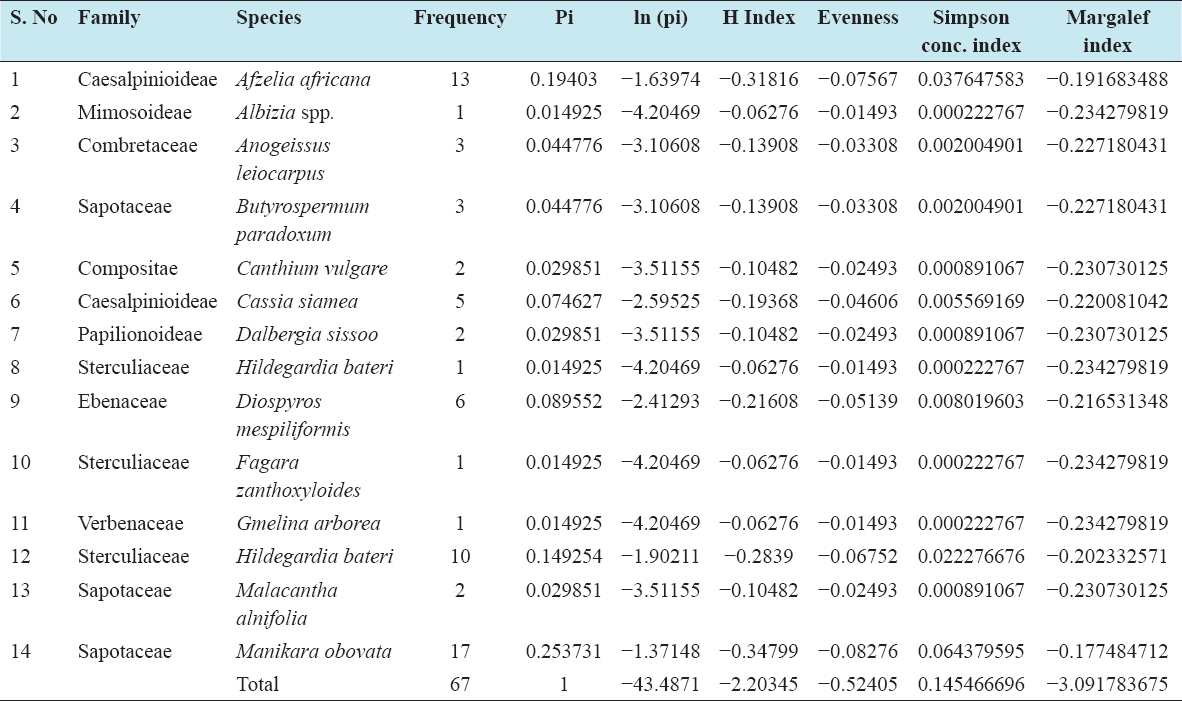
The effect of forest fire on the forest trees at Olokemeji forest reserve (F.R.) was established in this study. The fire experimental plot was selected at the reserve. The site was divided into three plots; plot A was tested with late fire treatment, plot B was tested with early fire treatment, and plot C (without fire treatment). The diameter at breast height and tree height (m) of the tree species in the plots were assessed prior and post-fire treatment. The diversity indices such as Shannon Wiener diversity index (H+), Simpson index, Margalef index, and species evenness were also obtained. The result of the tree height (m) showed that the highest tree height was in plot C followed by plot A and plot B with mean value of 15.25, 10.95, and 8.95 m, respectively. The highest basal area (m2) was found in plot C followed by plot A and plot B with a mean value of 0.64, 0.55, and 0.30 m2, respectively. The number of stems per plot ranged from 25 to 67. The Shannon Wiener diversity index shows that plot C had the highest index followed by plot A and plot B with value of 2.20, 1.72, and 1.45, respectively. The Margalef index ranged from 1.74 to 1.09, while Simpson index ranged from 0.14 to 0.32. This study has established the effect and relevance of fire on forest and wildlife management. Hence, the study recommends that this kind of research should be replicated in other F.Rs in other to have continuous foster future dynamics of the forest ecosystems. Fire is to be completely protected from the forest to prevent vegetation switch from forest to savanna and the production of timber. Prescribed or controlled burning is an appropriate silvicultural management tool for stimulating basal area growth, production of tree species seedlings and saplings.

Keywords: Fire regime, fire treatment, forest fire, species composition, species diversity


INTRODUCTION

The improper use of fire has destroyed many ecosystems resulting in uncalculated losses, as stated by Soares.[1] Forest resources have been greatly impoverished due to this phenomenon. In Nigeria, fire has contributed immensely to desertification and gradual destruction of the rain forests; aiding the formation of derived savannah vegetation;[2] and the extinction of many economic tree species.[3]

In spite of its present threat to mankind, history reveals the importance of fire as a tool used by man all through the ages. In the Nigeria forest regions today, the hunters still need fire for their game activities, shifting cultivators for clearing their fields, while grazers cannot do without fire for their pastoral improvement activities. However, the uncontrolled use of fire, the increasing population of forest land-users and the threat to the global population, which results from the massive destruction of the tropical forests in general and the Nigeria forests in particular, called for and received international attention over a decade ago[4] reported that about 70% of the Nigerian tree population is affected annually by fire and losses worth millions of dollars, due to forest fires on both forest and agricultural crops in Nigeria. Besides, this socioeconomic effect of forest fires is the detrimental ecological influences of forest fires on the ecosystems, tree population dynamics, quality, and growth of the different vegetation. It is, therefore, needful to know exactly what happens to individual tree growth, in a supposedly natural forest affected annually by fire. It is possible for such trees to regenerate naturally after incidences of moderate or intense forest fire occurrences.

A fire investigation plot was set-up in 1929 within the Olokemeji Forest Reserve (F.R.). Initially, the experiment was meant to procure a feasible time of burning the field for shifting cultivators, so as to check the threat to the forest depletion. Thus, between 1929 and 1969, trees on the plot were only counted for numbers. It was in 1969 that the local foresters thought is wise to measure this plot for diameter at breast height (d.b.h), every decade, while the treatments of annual burning continue. Such an annual burning prescription agrees with the recommended interval of burning (1–3 years) in regions of medium annual precipitation. The present study gives an overview of the growth dynamics of tree species under three distinct and recognizable vegetation types, though formed under the influence of annual fires in Olokemeji F.R.

MATERIALS AND METHODS

The Study Sites

Olokemeji forest reserve (F.R.), is located on latitude 70° 25’ North and longitude 3° 32’ East The study site lies within this F.R. approximately 32 km west of Ibadan city and 35 km as shown in Figure 1. The fire investigation plot was set up in 1929 by the colonial masters. In Aubreville[5] classification, Olokemeji falls within the region of Sous-climate, a subdivision of the Climate Guinea-forest, with <30 mm rainfall. It is lies on the transition between the Lowland Rain Forest and Derived Savanna zones.[6] Moist forest of several types covers the remainder of the reserve, except for areas of plantations. The reserve is lying between altitudes 90 m and 140 m above sea level.

thumblarge

Figure 1: The study area. Source: Remote sensing and GIS section, FRIN, 2019

Data Collection Method

Sample plot location

The investigation 254 at Olokemeji was divided into three parts plot A late burning, plot B early burning, and plot C control. Each plot measuring 0.42 acre (0.1735 Ha.), the plots were separated from one another by fire traces/fire ride.

Burning of the Plots

Plot A was set on fire at the peak of the dry season on March 12, 2019, while plot B was set on fire at the initial stage of the dry season on November 22, 2018 as shown in Plate 1.

thumblarge

Plate 1: Fire treatment in progress

Tree Girth and Height Measurements

Measurement of individual trees at the investigation plot was carried out before and after the fire treatment of plot A and plot B, each tree (10 cm girth and above) were measured for girth at breast height, with a girthing tape.

Data Analysis

Basal area calculation

The basal area of all trees in the sample plots was calculated using the formula:

thumb

Where BA = Basal area (m2), D = Diameter at breast height (cm) and π = Pie (3.142).

Tree Species Classification and Diversity Indices

All the trees encountered were assigned to families and number of species in each family was obtained for tree species diversity classification. Frequency of occurrence was obtained for species abundance/richness. This was repeated for all plants encountered in the sample plots for the two sites. The following biodiversity indices were used to obtain tree species richness and evenness within the forest. They were also used as indices for comparing biodiversity as an indication of biodiversity loss. Species relative density number of individuals per hectare was obtained using the formula given by Oduwaiye et al.:[7]

thumb

Where RD = Relative density, ni = Number of individuals of species I, and N = total number of individuals in the entire population. Species diversity is the number of different species in a particular area. This was obtained using a mathematical formula that takes into account the species richness and abundance of each species in the ecological community. The equation for the Shannon-Wiener diversity index given by Oduwaiye et al.[7] was used:

thumb

H1 is the Shannon diversity index, S is the total number of species in the community, pi is the proportion of a species to the total number of plants in the community, and Ln is the natural logarithm

Species evenness (E) measures the distribution of the number of individual in each species. It was determined using Shannon’s equitability (EH) as stated:[7]

thumb

S is the total number of species in each community, H+ is Shannon Wiener index.

ni = Number of individuals of species i and N = total number of individuals in the entire population.

Ln =Natural logarithm.

Margalef’s index of species richness (M).

thumb

Simpson concentration (λ) index.

thumb

RESULTS AND DISCUSSION

Tables1-3 presents the descriptive statistics for tree height (m) in the study area, descriptive statistics for diameter at breast height (cm) in the study area and Descriptive statistics for basal area (m2) in the study area respectively. Biodiversity indices are generated to bring the diversity and abundance of species in different habitats to similar scale for comparison and the higher the value the greater the species riches.[8] According to family distribution, plot A was found to be dominated by family of Papilionoideae and other important families of high frequency in plot A are Combretaceae, Verbenaceae, Mimosoideae, Sapotaceae, and Meliaceae. Plot B was also found dominated by the family of Papilionoideae with species of Dalbergia sissoo followed by Verbenaceae with species of Gmelina arborea, Combretaceae, Anacardiaceae, and Euphorbiaceae. Plot C was found dominated by Sapotaceae followed Caesalpinioideae, Sterculiaceae, Ebenaceae, and Verbenaceae. This result is an indication that the study area though affected by fire intensity is a replica of true tropical ecosystem. This is in accordance with the findings of Adekunle,[9] who reported that the tropical rainforest ecosystem of Southwest Nigeria is dominated by these set of families. In a similar study, Meliaceae, Euphorbiaceae, and Moraceae were reported as the families that dominated the tropical rainforest of Doi Inthanon, Thailand.[10] Likewise, the family species distributions indicated that both plots A and B were affected by fire intensity, thereby resulted into their low family and species distribution, while plot C had the highest family and species distribution. In tall, moist forests, fire tends to be rare but kills nearly all plants and to induce regeneration from seeds that either stored on the crown or in the soil, depending on species. Bark thickness varies with species and increases with stem diameter, thus serve as a defense mechanism during a forest fire.[11] Concluded that grassland species not only survive frequent burning but actually need it to maintain species diversity. Fire sometimes boosts tree health and nitrogen fixed by wattles arising after burning may have invaded forest.[12] The structure and function of the forest ecosystem are determined by plant component more than any other living component of the system. The plant diversity at any site is influenced by species distribution and abundance patterns[13] and the richest of plant species is controlled by a variety of biotic and abiotic parameters.[14] The Shannon–Wiener (H+), Paules, evenness, Simpson concentration index, and Margalef index were used to established the species diversity and richness at Olokemeji F.R as shown in Tables 4-6. The result of Shannon Wiener (H+) shows that plot C had the highest index followed by plot A and plot B with H+ index values of 2.20, 1.72, and 1.45, respectively. This result is a pointer to the fact that plot C which served as a control without interference was the most diverse. Therefore, it could be deduced that both early and late burning had an adverse effect on species diversity. Similar pattern was found for species richness which was computed using species evenness (E) and Margalef index (M) of species richness. The evenness ranged from 0.36 to 0.52 and Margalef index ranges from 1.74 to 3.09 with the highest found in plot C and least in plot B, respectively. Simpson concentration index on the other hand showed that the highest value was found in plot B followed by plot A and plot C with values of 0.32, 0.21, and 0.14, respectively. The Shannon Wiener, evenness, Simpson concentration, and Margalef index obtained in this study compared a bit below values obtained by Adekunle[9] in Akure strict nature reserve Nigeria.[15] Obtained a Shannon index that ranged between 2.69 and 3.33 which indicted a lesser diverse ecosystem.[16] Obtained Shannon index ranged between 2.94 and 3.96 for a sacred grove in South-Eastern Ghats, India. Sacred groves are traditional in situ conservation methods of biodiversity.

Table 1: Descriptive statistics for tree height (m) in the study area

thumblarge

Table 2: Descriptive statistics for diameter at breast height (cm) in the study area

thumblarge

Table 3: Descriptive statistics for basal area (m2) in the study area

thumblarge

Table 4: Tree species diversity indices obtained in plot A after late‑year burning

thumblarge

Table 5: Tree species diversity indices obtained in plot B after early year burning

thumblarge

Table 6: Tree species diversity indices obtained in plot C (control plot) without burning

thumblarge

CONCLUSION

The effect of different fire regimes on the species composition, diversity, and regeneration potentials of Olokemeji F.R, Southwest Nigeria, was established in this study. Precise assessment and understanding of the dynamics of plant resources are important for their sustainable management, utilization, and biodiversity conservation. The values of tree height and diameter class revealed a forest that is still undergoing developments majority of the trees occupied the middle stratum class. The floristic composition of the study area is dominated by a suite of understory species because of the dominance of small stemmed trees. The structure of the forest is an indication that the forest is not fully matured; this undergoing growth and development. Tree species diversity as revealed by the study area is an indication that the study area is a representative of a tree tropical ecosystem. The tree species recorded at the study area are trees of high economic, social, and environmental values. The diversity indices obtained revealed that the study area is a lesser diverse ecosystem. The regeneration potential of the study area was reported to be equally noteworthy. The selected plots regenerated seedlings and saplings of high economic, social, and environmental importance.

REFERENCES

1. Soares RV. Ecological and Economics Consequences of Forest Fires:The Brazilian Example. In:ACTAS Proceedings. Vol. 2. 10th World Forestry Congress, Paris, 1992. Underlying Causes of Deforestation. UN Secretary-General's Report;1991. 405-14. Available from:https://wrm.org.uy/.

2. Ola-Adams BA. Fire in Nigeria Savanna. Paper Presented at the Workshop on Forest Fires:Ecology and Environmental at FRIN Ibadan Nigeria 10th-12th October;1983.

3. Kio PR, Nnaobi CH. An Economic Analysis of the Effects of Forest Fire A Case Study of Plantation Losses in the 1982/83 Dry Season in Southern Nigeria Paper Presented at the Workshop on Forests Fire:Ecology and Environment FRIN Ibadan, Nigeria, 10th-12th October;1983.

4. Food and Agriculture Organization. Global Forest Resources Assessment 2005. Progress towards Sustainable Forest Management. Vol. 147. Rome, Italy:Food and Agriculture Organization Forestry Paper;2006. 329.

5. Aubreville A. Climate, Forest Desertification de l'Afrique Tropicale, Paris;1949.

6. Keay RW. An Outline of Nigeria Vegetation. 2nd ed. Lagos:Government Printer;1953.

7. Oduwaiye EA, Oyeleye B, Oguntala AB. Species Diversity and Potentiality for Forest Regeneration in Okomu Permanent Sample Plot. In:FAN Proceeding 28th Annual Conference Held in Akure, Ondo State 4th-8th Nov;2002. p. 264-71.

8. Indian Institute of Remote Sensing. Biodiversity Characterization at Landscape Level in Western Ghats India Using Satellite Remote Sensing and GIS. Dehradun, Uttaranchal:Indian Institute of Remote Sensing, National Remote Sensing Agency;2002.

9. Adekunle VA. Conservation of tree species diversity in tropical rain forest ecosystem of South West Nigeria. J Trop Forest Sci 2006;18:91-101.

10. Kanzaki M, Hara M, Yamakura T, Ohkubo T, Tamyra MN, Sri-Ngernyuan GK, et al. Forest diversity and dynamism:Findings from a large-scale plot network. In:Losos EC, Leigh EG, editors. The Diversity of Tropical Trees:Background. Chicago:Chicago University Press;2004. 474-81.

11. Watson, P. Different Strokes for Different Vegetation Types. In:Proceedings of a Conference on Ecologically Sustainable Bushfire Management. Sydney:Nature Conservation Council of NSW;2002. 66-77.

12. Ellis RC, Mount AB, Mattay JP. Recovery of Eucalyptus delegatensis from high altitude dieback after felling and burning the understorey. Aust Forest 1980;43:29-35.

13. Palit D, Pal S, Chanda S. Diversity and richness of plants in Darjeeling Himalaya with an eye on Gaddikhana forest beat, Senchal East Zone forest range, Darjeeling. Indian J Forest 2012;35:39-44.

14. Rannie WF. Summer air temperature and number of vascular species in arctic Canada. Arctic 1986;39:133-7.

15. Duran E, Meave JA, Lott DJ, Segura G. Structure and tree diversity patterns at landscape level in a Mexican tropical deciduous forest. Bol Soc Bot Mexico 2006;79:43-60.

16. Rao BR, Babu MV, Reddy MS, Reddy AM, Rao VS, Sunitha S, et al. Sacred groves in Southern Eastern Ghats, India:Are they better managed than forest reserves? Trop Ecol 2011;52:79-90.