large

Analysis of quality of service parameters on edge computing Ethernet local area network for data transportation

Nkolika O. Nwazor*, Stella I. Orakwue,

Department of Electrical and Electronic Engineering, University of Port Harcourt, Harcourt, Nigeria

Address for correspondence: Nkolika O. Nwazor, Department of Electrical and Electronic Engineering, University of Port Harcourt, Harcourt, Nigeria. E-amil: nkolika.nwazor@uniport.edu.ng
Submitted: 07-03-2020, Accepted: 17-03-2020, Published: 30-03-2020

ABSTRACT

In this era of growing technology (internet of things [IOT] in particular) and broadband network, the amount of data generated on a daily basis is on the increase. The bulk of data is frequently processed in the cloud, at various data centers. Consequently, limited network bandwidth and latency have hampered processing. Edge computing has closed up some of these bottlenecks. Performance of edge computing Ethernet local area network (LAN) is critical for the success of networks. Performance models require accurate traffic models which can capture the statistical characteristics of actual traffic. This research seeks to establish the influence of QoS (quality of service) parameters on an Ethernet carrier-sense multiple access with collision detection based LAN, and to analyze network performance on the basis of QoS parameters-packet loss, bus utilization, and throughput. Throughput which is the main parameter of concern amidst all others was discovered to increase with a corresponding increase in offered load.

Keywords: Data transportation, edge computing, Ethernet, quality of service


INTRODUCTION

The application of communication techniques to the transportation of data has probably been the greatest development in the computer arena since the computer itself. It enables remote terminals to talk with the computers and also allows computers to laterally talk between themselves. Communication, the transfer of information that is intelligible to the machines, holds the key to the development and effective use of the networking technology.[1] Quality of service (QoS), on the other hand, is highly influenced by the traffic pattern as resources are allocated based on the packets generated by terminals in a network. The services rendered by Ethernet cannot be overestimated. Ethernet was designed to fill the middle ground between long-distance, low-speed networks and specialized, computer-room networks carrying data at high speeds for very limited distances. Ethernet is well suited to applications where a local communication medium must carry sporadic, occasionally heavy traffic at high peak data rates.

QoS Parameters

The performance of today’s networks is measured by QoS parameters,[2] such as:

  • Throughput: This is a term used to describe the capacity of a system to transfer data. There are different ways to define and measure throughput; this includes: The packet rate across the network; the packet rate of a specific application flow; the packet rate of host-to-host aggregated flows; and the packet rate of network-to-network aggregated flows. The amount of bandwidth allocated to different types of packets affects throughput

  • Delay (or latency): Is the amount of time that it takes for a packet to be transmitted from one point in a network to another point in the network. There are a number of factors that contribute to the amount of delay experienced by a packet as it traverses the network. They include forwarding delay, queuing delay, propagation delay, and serialization delay. The end-to-end delay can be calculated as the sum of the individual forwarding, queuing, propagation, and serialization delays occurring at each node and link in the network

  • Jitter: Is the variation in delay over time experienced by consecutive packets that are part of the same flow. It is measured using mean, standard deviation, maximum or minimum of the inter-packet arrival times for consecutive packets in a given flow. End-to-end jitter is never constant because the level of network congestion always changes from time to time and from place to place

  • Loss: Is a situation where packets in a network fail to reach their destination due to break in the link, corruption of packets, or buffer overflow. The amount of packet loss in a network is typically expressed in terms of the probability that the network will discard a given packet. The loss is measured by rate – the number of packets lost, out of the total number transmitted

  • Blocking probability: The chance or probability that all the buffers are full and any subsequent packets are dropped (blocked)

  • Error rate: Sometimes packets are misdirected, or combined together, or corrupted, while en-route to its destination. The number of such packets from the total number transmitted within a given period gives an error rate. To ensure the integrity of traffic, QoS parameters must be met over the entire network.

Edge Computing

Edge computing is a decentralized computing infrastructure in which computing resources and application services can be distributed along the communication path from the data source to the cloud. That means computational needs can be satisfied “at the edge,” where the data are collected, or where the user performs certain actions. The benefits are improved performance, compliance, data privacy, and data security concerns are satisfied; reduced operational cost.[3]

It targets to enhance the network efficiency by harnessing the effectiveness of both cloud computing and mobile devices in the user’s proximity. Edge computing has been introduced to reduce network stress (i.e., latency) by shifting resources at the edge of the network to the proximity of mobile users and IOT while providing services and seamlessly processing the contents. As it implies, the idea of edge computing has emanated from cloud computing leading toward mobile cloud resources at the edge of the network with low latency and high bandwidth.[4] Edge, as a concept, can be misleading. The authors in Weisang et al.[5] defined edge as any computing and network resources along the path between data sources and cloud data centers.

REVIEW OF RELATED WORKS

A multiple-access protocols suitable for packet switching local area networks (LANs) that uses several parallel broadcast channels were proposed and analyzed in Takine et al.[6] by evaluating their throughput and delay characteristics considering a variety of multiple-access schemes that are derived from carrier sense multiple access (CSMA) and CSMA with collision detection (CSMA/CD) protocols. It was shown that significant performance improvements are achievable with the multiple channel option.[6] In work, an infinite population model was assumed but not stated outrightly. The authors in Kiesel and Kuehn[7] considered a continuous-time CSMA/CD systems with a finite number of homogeneous stations, each possessing an infinite buffer. Conclusively, the stability of the system becomes more sensitive to the retransmission interval as the number of stations increases.[7] The implementation of a LAN operating under a new CSMA/CD protocol with dynamic priorities (CSMA-CD-DP) was reported in Takagi et al.[8] A generalized protocol combining contention mode in the idle state of the channel and reservation mode in the busy state of the channel was proposed. Hence, throughput was used as a performance index to implement the protocol.[8]

The QoS parameters such as throughput, delay, packet loss, and traffic utilization were expressed in different parameters in the different models. There is no single analytical model that holds all the QoS, parameters together. Thus, a simulation model will be used to find the relationship among the QoS parameters.

NETWORKING MODEL

Network modeling involves both source (traffic generator) modeling and network modeling. In this work, the modeling would be handled individually.

Network Architecture

In this work, the network architecture illustrated in Figure 1 was employed. This architecture had its origin at XEROX’s Palo Alto Research Center.[9] The operation of Ethernet can be explained briefly with the aid of the diagram in Figure 1. Work stations communicate through the transmission media (a cable) labeled Broadcast channel (Ethernet bus). The bus interface units (BIUs) which are along the link between the bus channel and the node provides the essential interfacing between the work station and this channel that is (transmit/receive capability of the channel) and all needed intelligence. It is an essential feature of Ethernet that by using the broadcast channel, any work station can transmit to any other station, and any station can listen to all transmissions on the channel, whether intended for it or some other station user.[10]

thumblarge

Figure 1: Architecture of an Ethernet network

Ethernet makes use of CSMA/CD as its mode of transmission. The Ethernet bus is passive and can be used for broadcast type transmissions. The terminal’s BIU before attempting to transmit a data packet onto the Ethernet bus first “listens” to determine if the BUS is idle that is if there are no other packets from other work station units on the BUS. It senses the presence of a carrier on the BUS.[10] Due to propagation delays and carrier detection time, a collision may occur when a BIU senses an idle BUS and begins to transmit its packet while another work stations’ BIU has already started transmitting a packet that has not yet propagated to this BIU. All BIU’s connected to the BUS have some means for “Collision Detection.” When a collision occurs, all parties involved cease transmission and wait a random amount of time before initiating retransmission. If collision occurs again, this random time wait is repeated but increased and increases at an exponential rate until the collision event disappears. This approach is called “truncated binary exponential back off algorithm.”[11]

The QoS parameters of an Ethernet (CSMA/CD) considered were throughput and channel utilization.

Structure of the Model

The model above consists of six node stations that are linked through the Ethernet link medium access control (MAC) controller transceivers are operating at 10 Mbps to terminators. The MAC comprised CSMA/CD protocol that governs how the node stations shared the traffic channel. The terminators at both ends are to prevent signal reflection. The Ethernet architecture is based on the principles of multiple access techniques.

Source Description

The source model was designed using the Simevent in the Simulink of the MATLAB 7.4 version. From the Simevent source generator, the event-based random number generator block was chosen, and the distribution needed for the model was chosen. For these distributions, the interarrival for each was specified using the distribution parameter which differs from one to the other. Moreover, this generator block was connected to the time-based entity generator, which generates an output based on the interarrival time of the distribution used in the event-based generator. The ON-OFF model was implemented using MATLAB simulation software. Figure 2 presents an example of an ON-OFF generator.

thumblarge

Figure 2: An example of the source ON-OFF generator

The total intensity generated by all sources is the constant value through all scenarios and does not depend on the source number. It means that the traffic intensity of each source is in inverse ratio to the number of sources. While the number of sources increases, the intensity of each individual source decreases and vice versa.

Node Model

The Ethernet station node model in Figure 3 represents an Ethernet station that connects to an Ethernet bus at 10 Mbps. The Ethernet MAC handles transmission requests from the higher layers, encapsulates packets into Ethernet frames and broadcasts these frames to all the stations attached to the bus. The MAC also handles carrier sensing, collision detection, and exponential back off. The supporting deference process calculates the deference variable for the MAC. The layers above the Ethernet MAC are modeled with a source and a sink. The Ethernet source generates and sends packets to the MAC layer. The sink discards any packets received from the MAC.

thumblarge

Figure 3: Carrier-sense multiple access with collision detection node model

The Ethernet station node model has four processor modules, a queue module which performs the bulk of the channel access processing, and a pair of bus receiver and transmitter modules. The bus_tx and bus_rx modules serve as the bus link interface. These modules are set to transmit and receive at a data rate of 10 Mbits/s by default. The sink processor represents higher layers and simply accepts incoming packets that have been processed through the mac process. The defer processor independently monitors the link’s condition and maintains a deference flag that the mac process reads over a statistic wire to decide whether the transmission is allowed. The bursty_gen module represents higher layer users who submit data for transmission. It uses an ON-OFF pattern for traffic generation.

The mac process handles both incoming and outgoing packets. Incoming packets are decapsulated from their Ethernet frames and delivered to a higher-level process. Outgoing packets are encapsulated within Ethernet frames, and when the deference flag goes low, a frame is sent to the transmitter. This process also monitors for collisions, and if one occurs, the transmission is appropriately terminated and rescheduled for a later attempt.

SIMULATION AND SIMULATION TEST

The results obtained from the model are presented here. The results are illustrated in graphical form in the figures below. The simulation was run using the OPNET simulator. The results were obtained for each of the QoS parameters specified.

Considering the channel utilization, packet loss rate and the error bit rate, the following input parameters were utilized:

  1. Packet generation rate for each node = 100 packet/s

  2. Minimum packet size = 200 bytes

  3. Maximum packet size = 1024 bytes

  4. Cable length between each node = 100 m.

The simulation was run for several times; each simulation lasted for 30 s. The packet sizes of the nodes were varied from 200 to 1024 bytes for different packet generation rates (arrival rates) of nodes while the parameters kept constant.

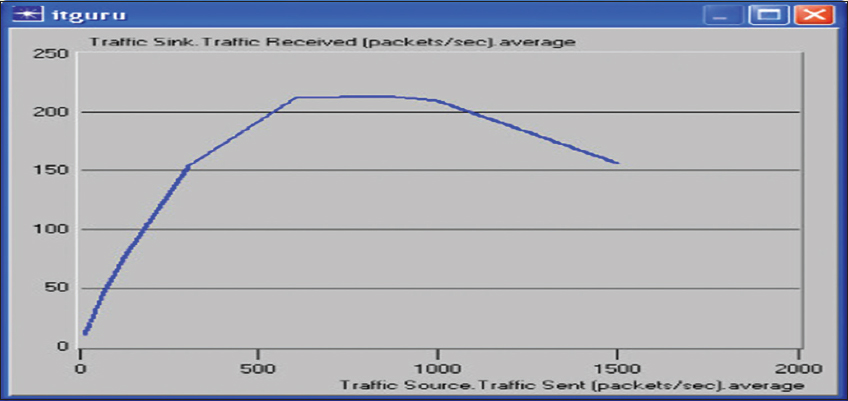
The constant parameters of the nodes include: Packet generation rate = 100 (packet/s), minimum packet size = 200 bytes, and maximum packet size = 1024 bytes. Other parameters kept constant are cable length between each node = 100 m. At the end of the simulation, graphs such as throughput, channel utilization, bit error rate, and packet loss rate against packet size were plotted. Figure 4 shows the graph of traffic received (throughput) against traffic sent (network load).

thumblarge

Figure 4: Graph of traffic received (throughput) against traffic sent (network load)

Initially, throughput increases with offered load and reaches a maximum value. After the maximum load is reached, any further load only leads to a decrease in the throughput. Therefore, to maximize the throughput in the network, the load must be chosen carefully. The fact is that, as the traffic on the network increases, more collisions occur, causing retransmission of frames and consequently increasing their overall delay.

Note that collisions increase as the network is loaded, and this causes retransmissions and increases in the load that causes even more collisions. The resulting network overload slows traffic considerably.

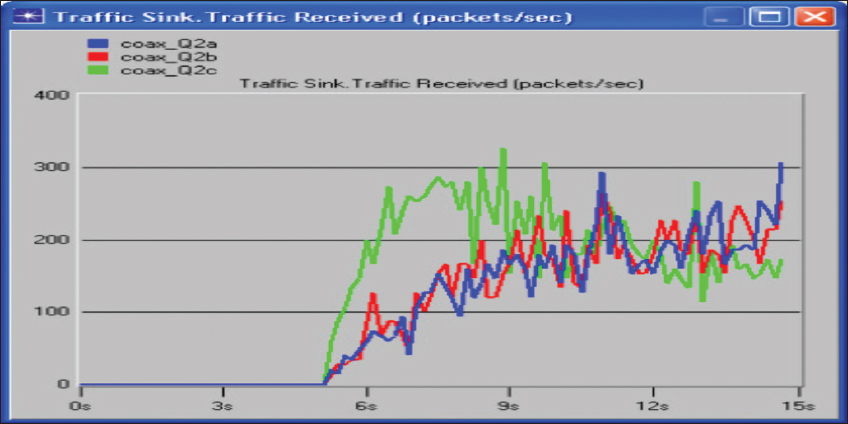
Figure 5 shows the graph of traffic received (throughput) against traffic sent (network load).

thumblarge

Figure 5: Graph of traffic received (throughput) against traffic sent (network load)

Three variations of the simulation scenario in Figure 4 were implemented: The coax_Q2a, coax_Q2b, and coax_Q2c cases, for which the inter-arrival time attribute of the packet generation arguments was set to the exponential factors of 0.1, 0.05, and 0.025, respectively. The results of the simulation are shown in Figure 5. Reveals that with decreasing the inter-arrival time, the throughput (traffic received) increases till a certain maximum throughput is reached, and then decreases.

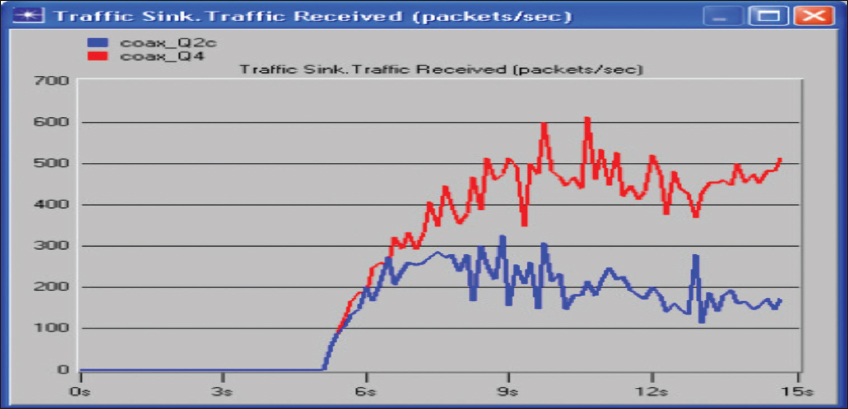
The effect of the packet size on the throughput of the Ethernet network reveals that the results are shown in Figure 6. This indicates that the throughput (traffic received) for the 512-byte packet (the coax_Q4 case) is greater than that one for the 1024-byte packets (the coax_Q2c case). Hence, when the packet size is increased, the throughput is reduced.

thumblarge

Figure 6: Graph of packet size on the throughput of the Ethernet network

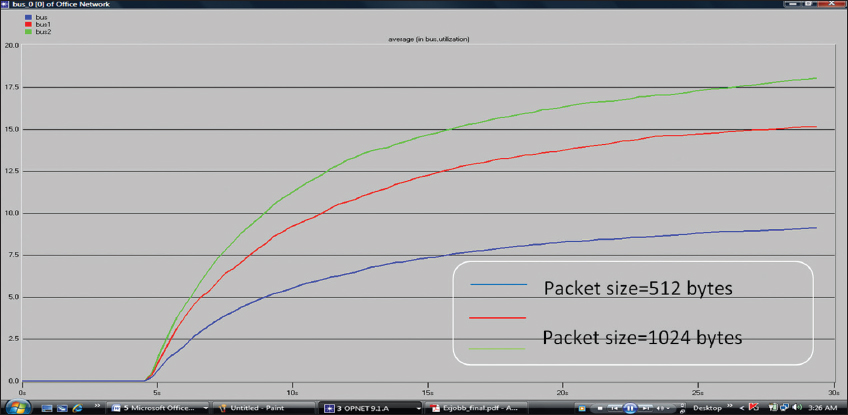
Figure 7 displays the graphs of channel utilization against packet arrival for different packet sizes. In the graph of channel utilization against packet arrival rate, there was an increase in utilization as the packet sizes increases. Channel utilization against packet arrival rate was a little slow at the packet size of 512 bytes as the packet arrival rate was increased.

thumblarge

Figure 7: Graph of channel utilization against packet arrival rate

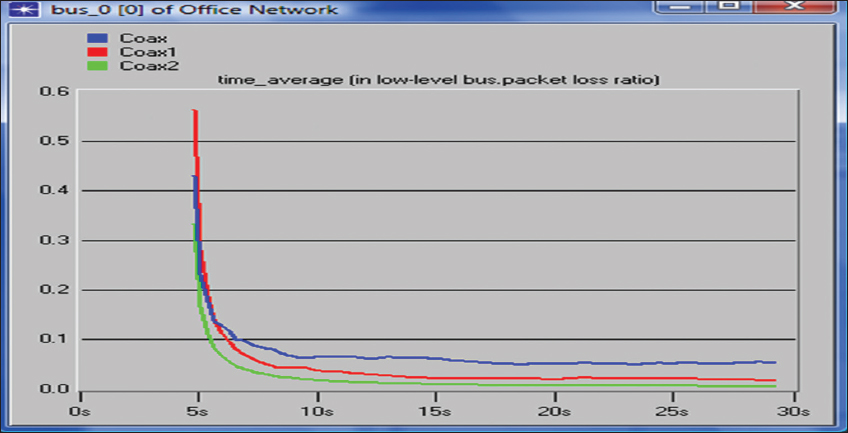
Figure 8 displays the graphs of packet loss rate against packet size for different packet arrival rates. The packet loss rate was significantly vertically steady at a point for each of the packet arrival rates as the packet size was increased, then finally, it became insensitive to change in packet size variation.

thumblarge

Figure 8: Graph of packet loss rate against time

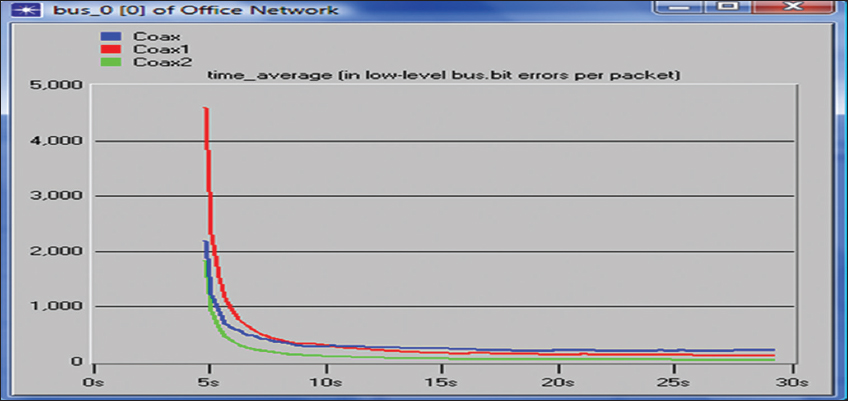
Figure 9 displays the graph of bit error rate against simulation time for different packet arrival rates. In the graph of bit error rate against simulation time, a decrease in arrival rate and an increase in size of the packet leads to an increase in the bit error rate as displayed in Coax1. A further decrease in arrival rate displays a decrease in bit error rate, as shown in Coax2.

thumblarge

Figure 9: Graph of bit error rate against simulation time

CONCLUSION

This work investigated and displayed how statistical parameters can be used to measure the performance of a CSMA/CD-based LAN. Throughput, which is the main parameter of concern amidst all others, was discovered to increase with a corresponding increase in offered load. Thus, in other to experience a good throughput, the offered load has to be managed properly.

Although some of these results are characteristic of the designed network, we can conclude that network performance is mainly based on the simplification of the traffic.

REFERENCES

1. Behrouz F. Data Communication and Networking. New York:McGraw Hill;2007.

2. Ambrosia JD. The Development of a Flexible Architecture. IEEE Communications Magazine;2009. 8.

3. Introduction to Edge Computing in IIOT. Industrial Internet Consortium;2018. Available from:https://www.iiconsortium.org/pdf/introduction_to_edge_computing_in_iiot_2018_06_18.pdf. [Last accessed on 20 Nov 2018].

4. Shahzadi S, Iqbal M, Tasos D, Zia Q. Multi-access edge computing:Open issues, challenge and future perspectives. J Cloud Comput Adv Syst Appl 2017;6:1-13.

5. Weisang S, Jie C, Quan Z, Youuizi L, Lanyu X. Edge computing:Vision and challenges. IEEE Internet Things J 2016;3:637-46.

6. Takine T, Takahashi Y, Hasegawa T. An approximate analysis of a buffered CSMA/CD. IEEE Trans Commun 1998;36:932-41.

7. Kiesel WM, Kuehn PJ. A new CSMA-CD protocol for local area networks with dynamic priorities and low collision probability. IEEE J Sel Areas Commun 1983;1:869-76.

8. Takagi A, Yamada S, Sugawara S. CSMA/CD with deterministic contention resolution. IEEE J Sel Areas Commun 1983;1:877-84.

9. LAN/MAN Standards Committee of the IEEE Computer Society. IEEE Standard for Local and Metropolitan Area Networks:Media Access Control (MAC) Bridges, No. 802.1D-2004. Washington, DC:LAN/MAN Standards Committee of the IEEE Computer Society;2014.

10. DEC, Xerox. The Ethernet, a Local Area Network:Data Link Layer and Physical Layer Specifications, Version 1.0. Stamford, CT:DEC, Xerox;1980.

11. Melander B, Bjorkman M, Gunningberg P. Long distance dynamic behavior of a CSMA-CD system with a finite population of buffered users.IEEE Trans Commun 1986;34:576-86.