large

Geospatial technique for runoff estimation based on soil conservation service curve number method in upper Cauvery Karnataka

Mohammed Badiuddin Parvez*, Amritha Thankachan, K. Chalapathi, M. Inayathulla, E. Chithaiah,

Department of Civil Engineering, University Visvesvaraya College of Engineering, Bengaluru University, Bengaluru, Karnataka, India

Address for correspondence: Mohammed Badiuddin Parvez, Department of Civil Engineering, University Visvesvaraya College of Engineering, Bengaluru University, Bengaluru, Karnataka, India. Tel.: +91-9060506390. E-mail: parvezuvce@gmail.com
Submitted: 15-02-2020, Accepted: 26-02-2020, Published: 30-03-2020

ABSTRACT

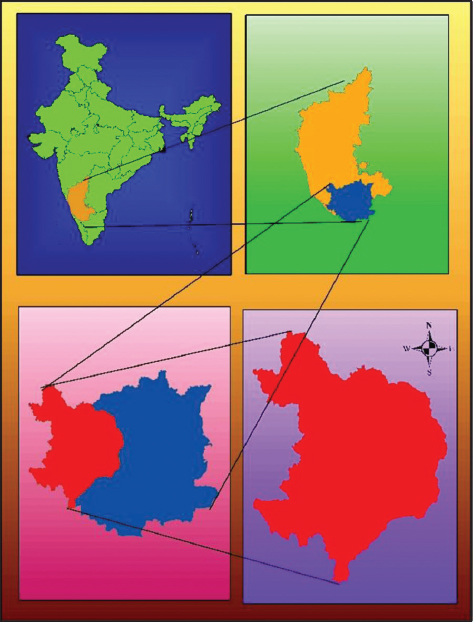
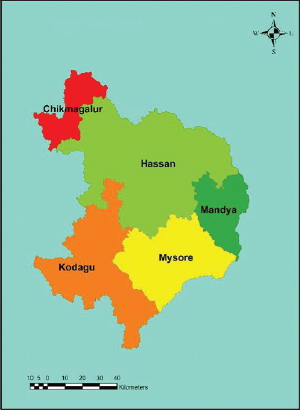
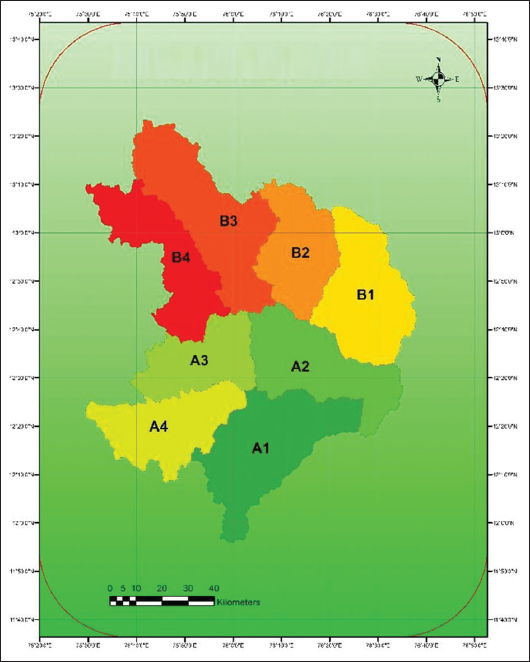
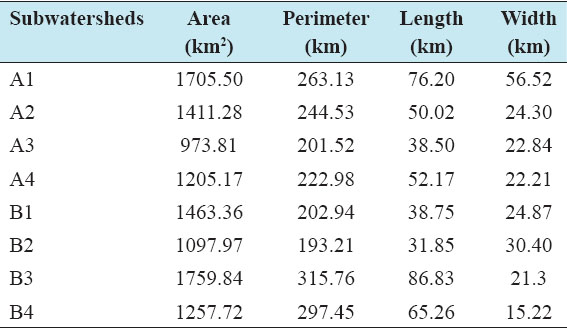
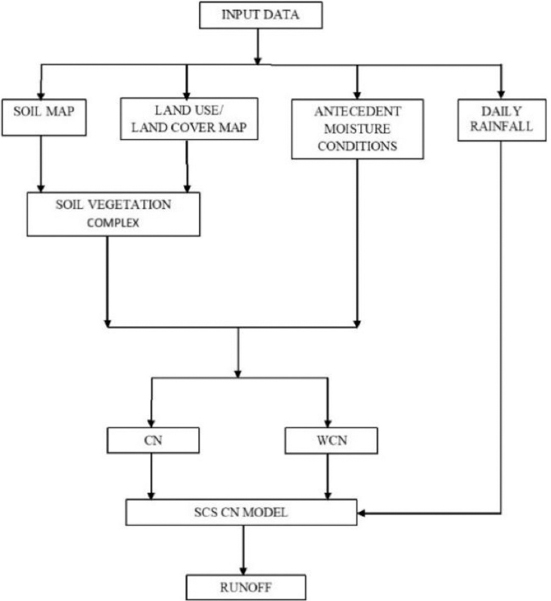
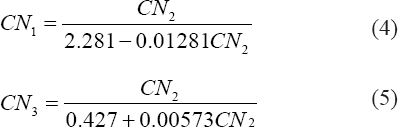
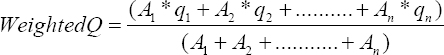
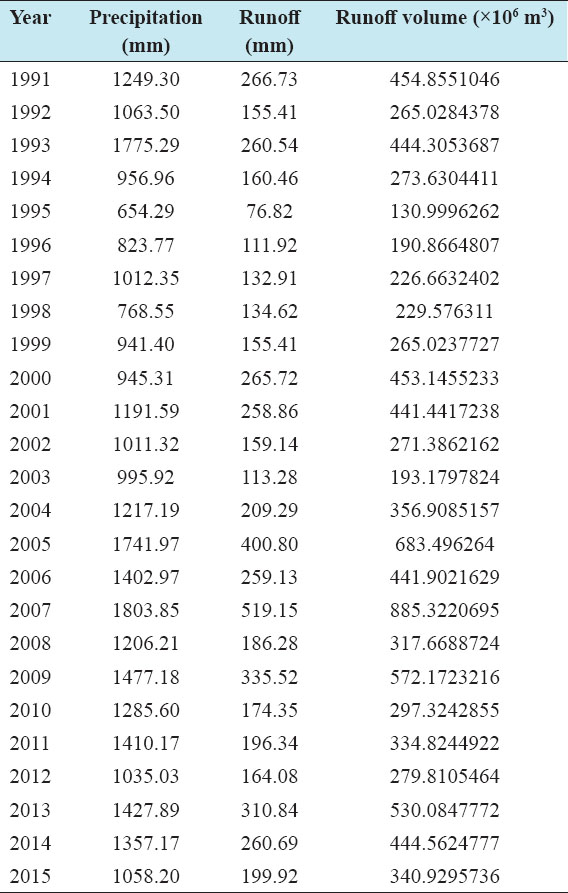
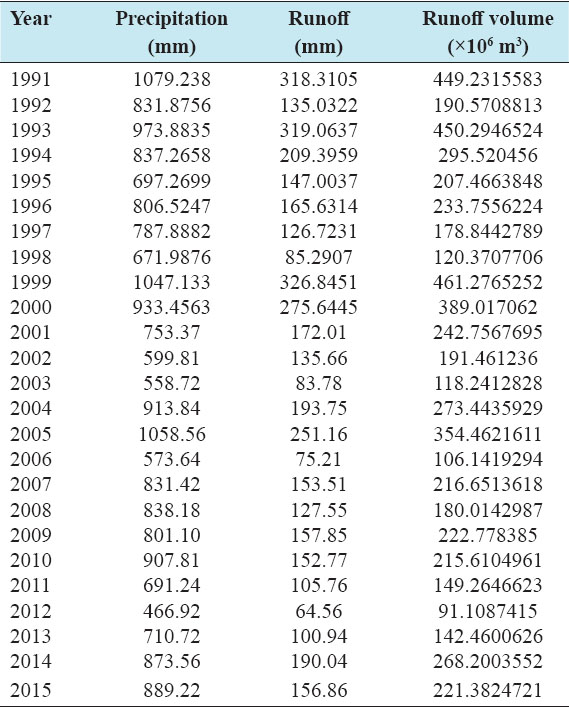
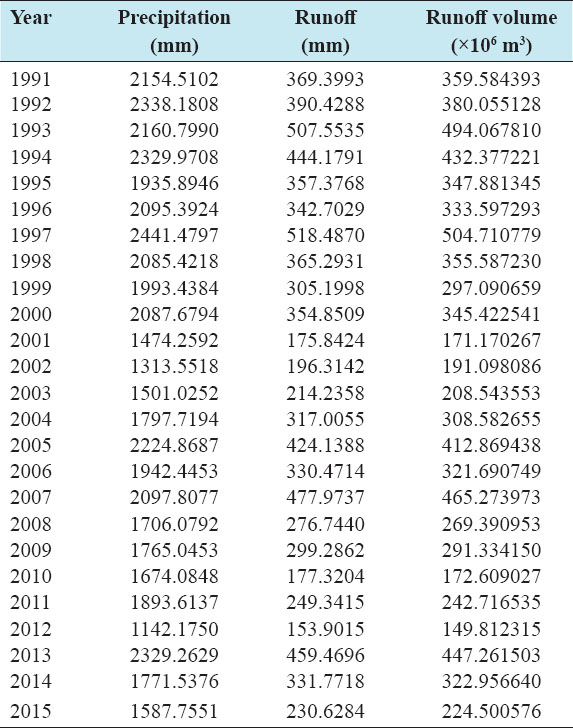
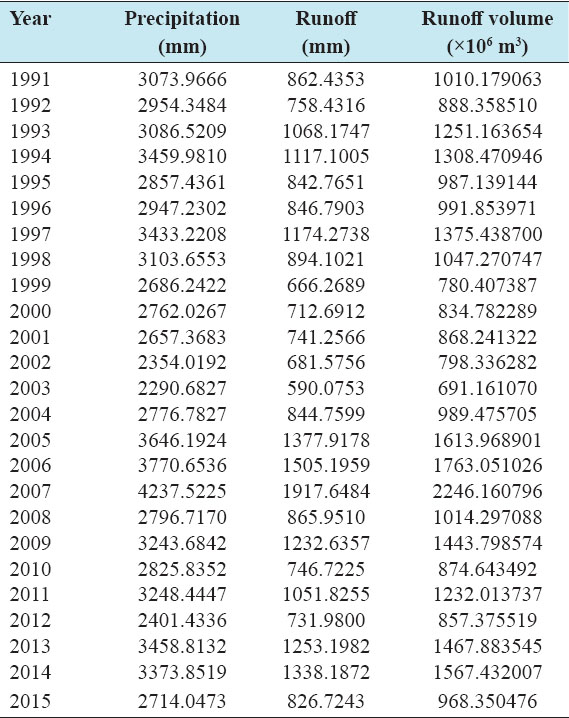
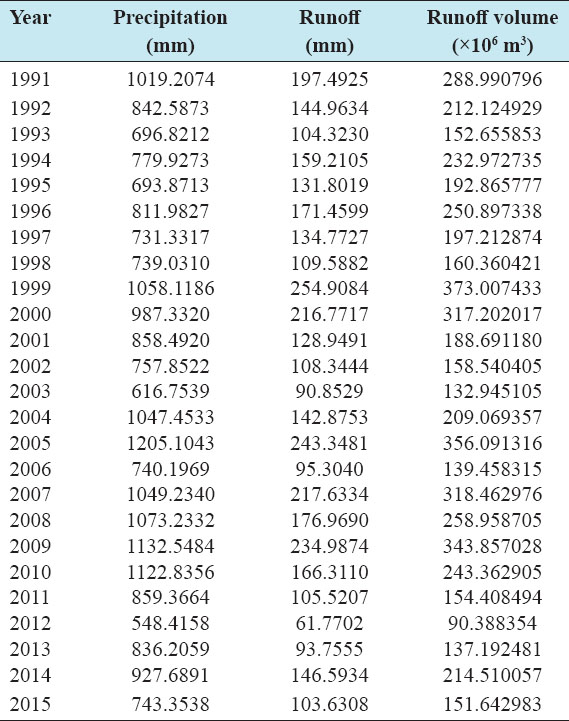
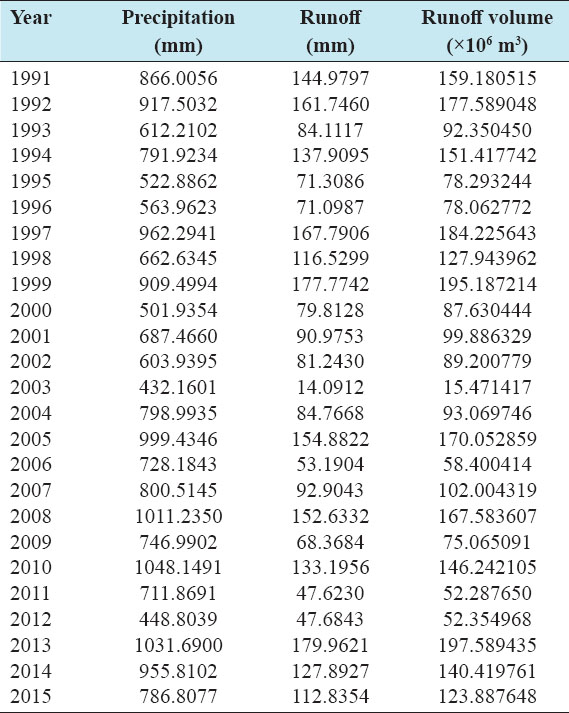
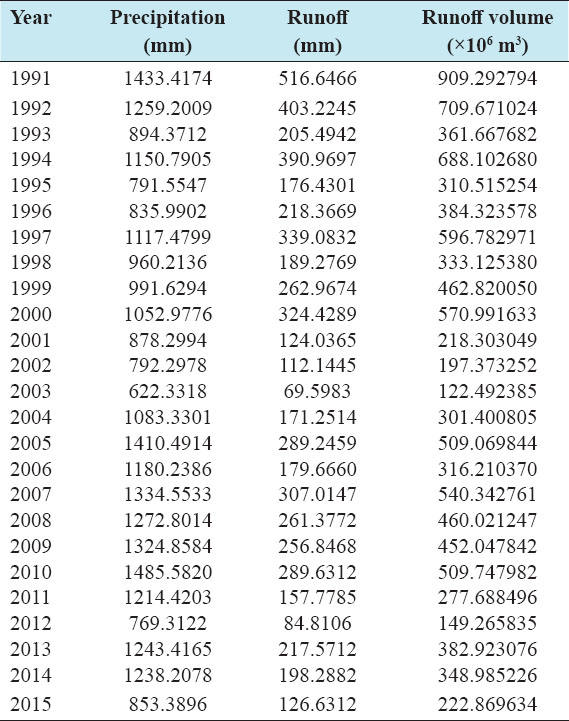
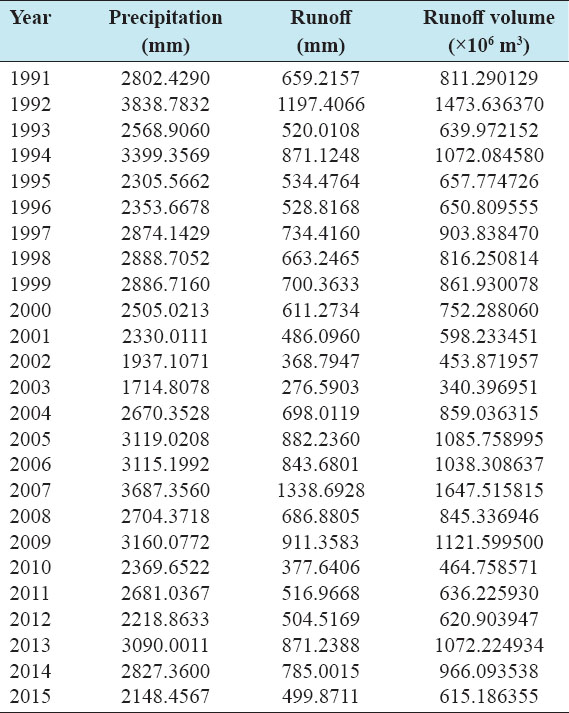
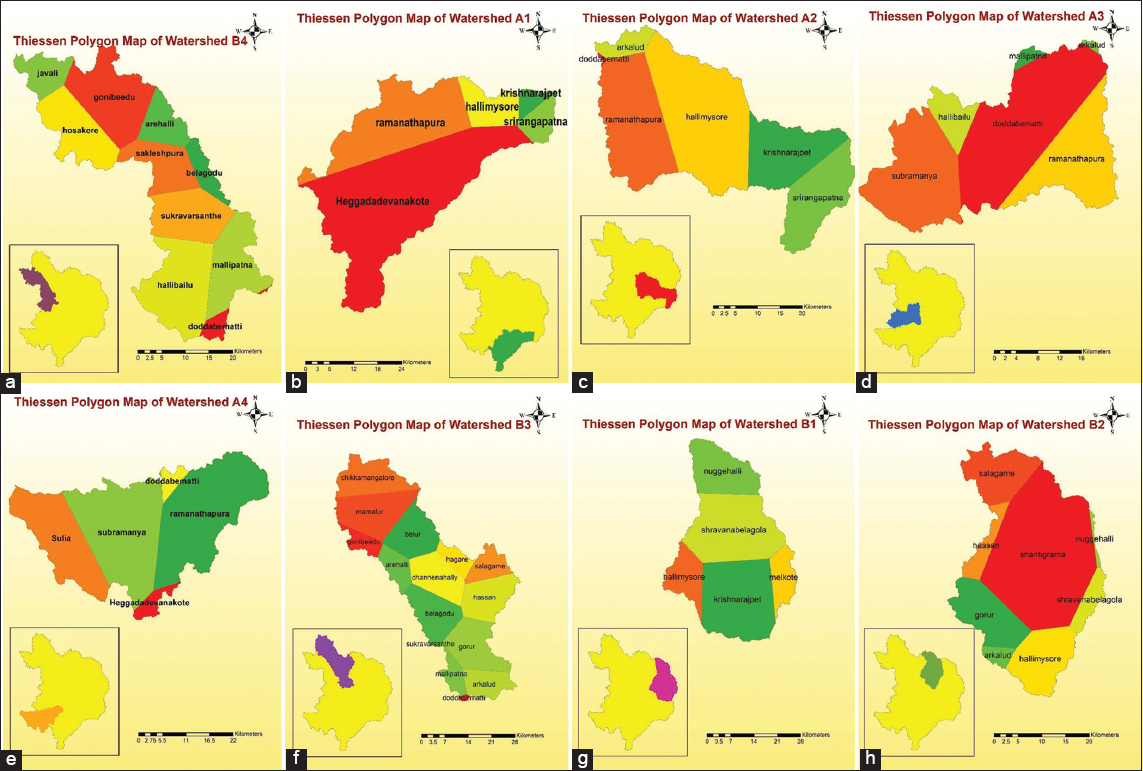
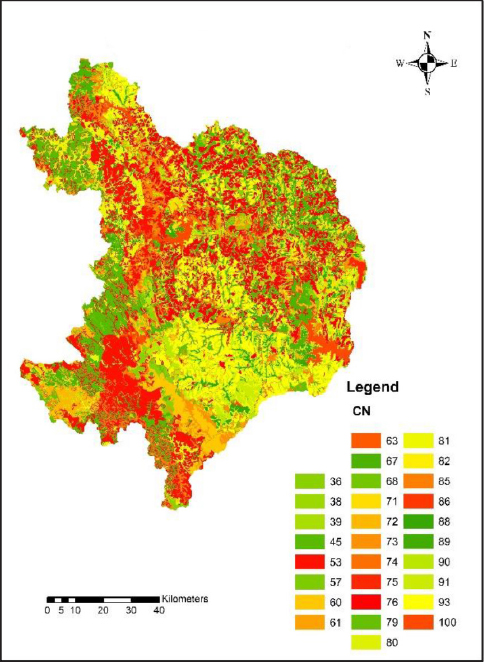
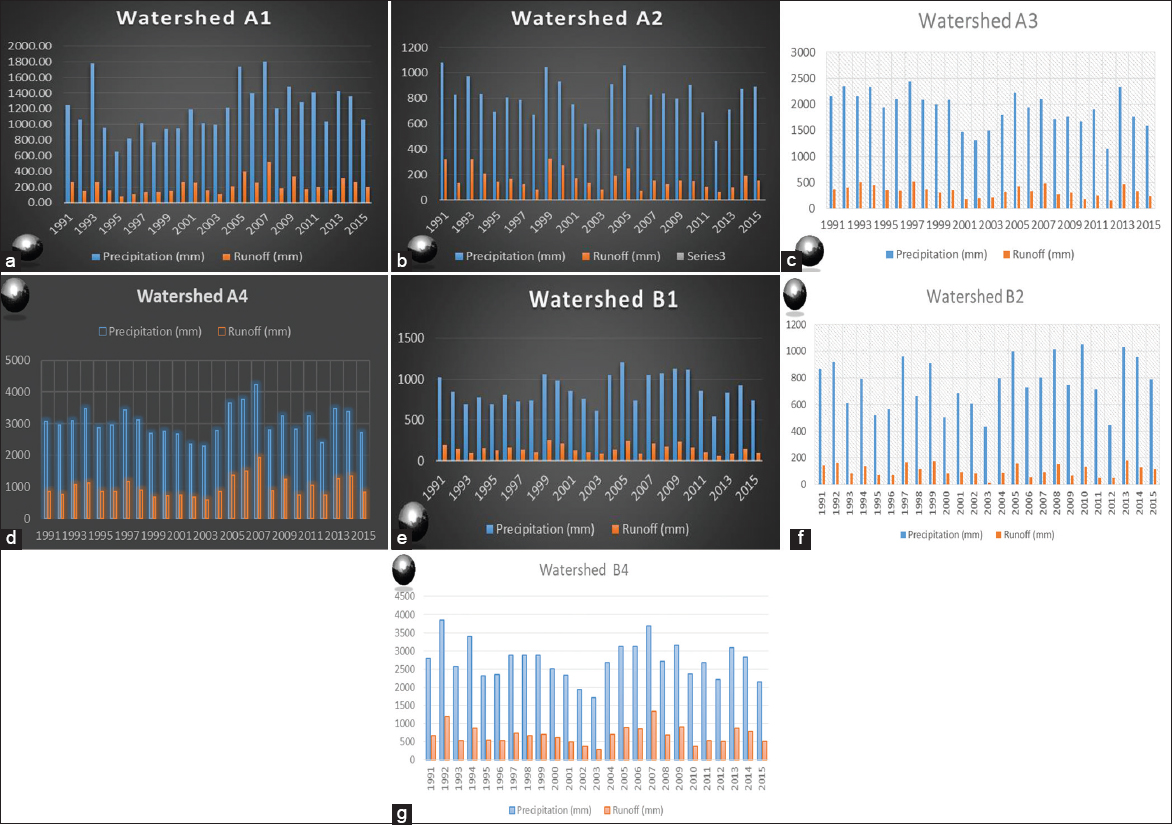
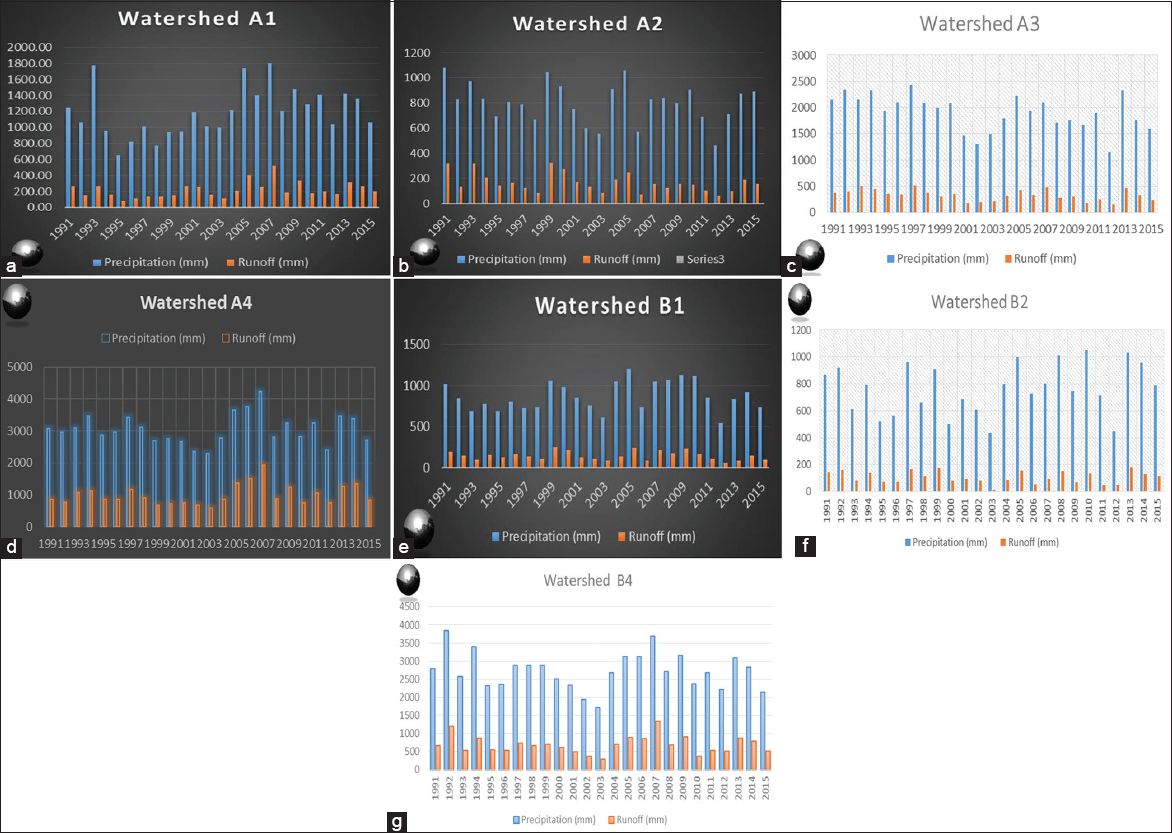
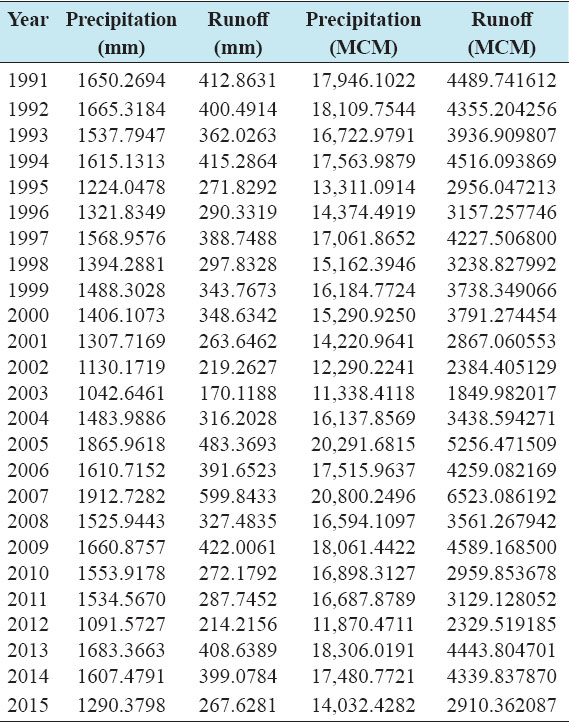
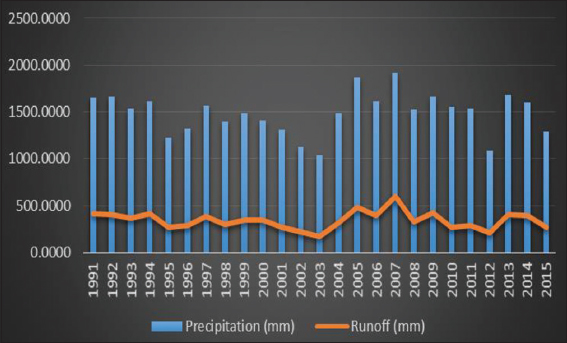
Accurate estimation of runoff and sediment yield amount is not only an important task in physiographic but also important for proper watershed management. Watershed is an ideal unit for planning and management of land and water resources. Direct runoff in a catchment depends on soil type, land cover, and rainfall. Of the many methods available for estimating runoff from rainfall, the curve number (CN) method (soil conservation service CN [SCS-CN]) is the most popular. The CN depends on soil and land use characteristics. This study was conducted in the upper Cauvery Karnataka using remote sensing and geographic information system (GIS). SCS-CN method has been used for surface runoff estimation for eight watersheds of upper Cauvery. The soil map and land use were created in the GIS environment because the CN method is used here as a distributed model. The major advantage of employing GIS in rainfall-runoff modeling is that more accurate sizing and catchment characterization can be achieved. Furthermore, the analysis can be performed much faster, especially when there is a complex mix of land use classes and different soil types. The results showed that the surface runoff ranged from 170.12 to 599.84 mm in the study area when rainfall rates were received from 1042.65 to 1912 mm. To find the relationship between rainfall and runoff rates, the straight-line equation was used. That was found that there was a strong correlation between runoff and precipitation rates. The value correlation coefficient between them was 86%. The average depth of runoff is more in watershed A4, the average runoff coefficient is less in watershed B2, and the correlation coefficient is high in A4 to a value of almost 89.5%.

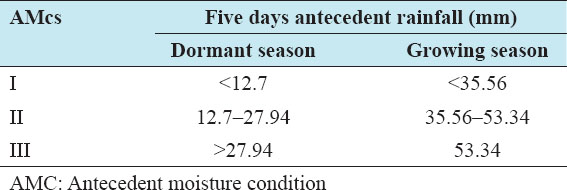
Keywords: Antecedent moisture condition, curve number, infiltration, rainfall, runoff, Thiessen polygon


INTRODUCTION

The conventional hydrologic data are inadequate for the purpose of design and operation of water resources system. Surface water runoff is a step in the water cycle on earth. When precipitation occurs, water only has a few locations where it can go. Water can infiltrate into the ground, evaporate, or become runoff. Runoff is the short way of saying surface water runoff. Rainfall-runoff is an important component contributing significantly to the hydrological cycle, design of hydrological structures, and morphology of the drainage system. Estimation of the same is required to determine and forecast its effects.[1] The problem of estimating runoff from a storm event is one of the key points in hydrologic modeling. Estimation of direct rainfall-runoff is always efficient but is not possible for most of the location at desired time. Classical techniques as the rational method or the soil conservation service curve number (SCS-CN) approach are still widely used in practice. Due to the complexity of the hydrological processes and the basin characteristics, physically based distributed models using geographic information system (GIS) and remote sensing techniques are becoming popular. The use of remote sensing and GIS technology can be used to overcome the problem of conventional method for estimating runoff caused due to rainfall. In this paper, modified SCS-CN model is used for rainfall-runoff estimation that considers parameter such as slope, vegetation cover, and area of watershed.

Water resources are essential renewable resources that are the basis for existence and development of a society. Proper utilization of these resources requires assessment and management of the quantity and quality of the water resources both spatially and temporally. Water crises caused by shortages, floods, and diminishing water quality, among others, are increasing in all parts of the world. The growth of population demands for increased domestic water supplies and, at the same time, results with a higher consumption of water due to expansion in agriculture and industry. Mismanagement and lack of knowledge of existing water resources and the changing climatic conditions have consequences of an imbalance of supply and demand of water. The problem is pronounced in semi-arid and arid areas where the resources are limited. Surface water being easy, direct, and, therefore, less expensive to exploit in comparison to other sources such as groundwater or desalinization makes it the major source of water supply for irrigation, industry, and domestic uses. The surface water, in the form of lakes and river discharge (runoff), is predominately obtained from rainfall after being generated by the rainfall-runoff processes. To make decisions for planning, design, and control of water resource systems, long runoff series are required. The latter are not often available with reasonable length. On the other hand, for flood control and reservoir regulation future, flows shall be forecasted with rainfall-runoff models. A number of rainfall-runoff models exist for the generation of flow, forecasting, and other purposes.[2] Establishing a rainfall-runoff relationship is the central focus of hydrological modeling from its simple form of unit hydrograph to rather complex models based on fully dynamic flow equations. As the computing capabilities are increasing, the use of these models to simulate a catchment became a standard. Models are generally used as utility in various areas of water resource development, in assessing the available resources, in studying the impact of human interference in an area such as land-use change, deforestation, and other hydraulic structure such as dams and reservoirs.

MATERIALS AND METHODS

Study Area

The study area geographically lies between 75°29’ 19” E and 76°37’ 40” E longitude and 11°55’ 54” N and 13°23’ 12.8” N latitude, as shown in Figure 1, and has an area of 10,874.65 Sq km.[3] The maximum length and width of the study area are approximately equal to 143.73 km and 96.75 km, respectively. The maximum and minimum elevation of the basin is 1867 m and 714 m above mean sea level, respectively. The study area covers five districts of Karnataka state, i.e., Chikmagalur, Hassan, Kodagu, Mandya, and Mysore, as shown in Figure 2.[4,5] It is divided into eight watersheds (A1, A2, A3, A4, B1, B2, B3, and B4), as shown in Figure 3.[6] The total area (A) and perimeter (P) of eight watersheds are calculated using ArcGIS and values are tabulated in Table 1.

thumblarge

Figure 1: Location map of the study area

thumblarge

Figure 2: Districts in the study area

thumblarge

Figure 3: Watershed map

Table 1: Watersheds of upper Cauvery catchment

thumblarge

The study area which is of 10,874.65 km2 was divided into eight watersheds as A1, A2, A3, A4, B1, B2, B3, and B4.

Methodology

SCS-CN model

In this model, runoff will be determined as a function of current soil moisture content, static soil conditions, and management practices. Runoff is deduced from the water available to enter the soil before infiltration. Figure 4 shows the methodology adopted for runoff estimation using SCS-CN method. This method is also called hydrologic soil cover complex number method. It is based on the recharge capacity of a watershed. The recharge capacity can be determined by the antecedent moisture contents and by the physical characteristics of the watershed. Basically, the CN is an index that represents the combination of hydrologic soil group and antecedent moisture conditions (AMCs). The SCS prepared an index, which is called as the runoff CN to represent the combined hydrologic effect of soil, land use and land cover, agriculture class, hydrologic conditions, and antecedent soil moisture conditions. These factors can be accessed from soil survey and the site investigations and land use maps, while using the hydrologic model for the design.

thumblarge

Figure 4: Methodology soil conservation service curve number

The specifications of AMCs are often a policy decision that suggests the average watershed conditions rather than recognitions of hydrologic conditions at a particular time and place.

Expressed mathematically as given,

thumblarge

Where, Q is the runoff, P is the precipitation, and F is the infiltrations and it is the difference between the potential and accumulated runoff. Ia is beginning abstraction, which represents all the losses before the runoff begins. It includes water retained in surface depressions, water intercepted by vegetation, and initial infiltrations. This is variable but generally is correlated with soil and land cover parameter; S is the potential infiltrations after the runoff begins.

Thus, a runoff CNs is defined to relate the unknown S as spatially distributed variables are as follows:

thumblarge

Determination of CN

The SCS cover complex classification consists of three factors: Land use, treatment of practice, and hydrologic condition. There are approximately eight different land use classes that are identified in the tables for estimating CN. Cultivated land uses are often subdivided by treatment or practices such as contoured or straight row. This separation reflects the different hydrologic runoff potential that is associated with variation in land treatment. The hydrologic condition reflects the level of land management; it is separated with three classes as poor, fair, and good. Not all of the land use classes are separated by treatment or condition.

CN values for different land uses, treatment, and hydrologic conditions were assigned based on the CN table. Runoff CNs for AMC II hydrologic soil cover complex are shown in Table 2.

Table 2: Runoff curve numbers for AMC II hydrologic soil cover complex

thumblarge

Hydrological soil group classification

SCS developed a soil classification system that consists of four groups, which are identified as A, B, C, and D according to their minimum infiltration rate. The identification of the particular SCS soil group at a site can be done by one of the following three ways: (i) Soil characteristics, (ii) county soil surveys, and (iii) minimum infiltration rates. Table 3 shows the minimum infiltration rates associated with each soil group.

Table 3: Minimum infiltration rates associated with each soil group

thumblarge

AMCs

AMC refers to the water content present in the soil at a given time. The AMC value is intended to reflect the effect of infiltration on both the volume and rate of runoff according to the infiltration curve. The SCS developed three antecedent soil moisture conditions and labeled them as I, II, and III.[7-14]

The value of CN is shown for AMC II and for a variety of land uses, soil treatment, or farming practices. The hydrologic condition refers to the state of the vegetation growth [Table 4]. The CN values for AMC-I and AMC-III can be obtained from AMC-II by the method of conservation. The empirical CN1 and CN3 equations for conservation methods are as follows:

Table 4: AMCs

thumblarge

thumblarge

A weighted runoff was estimated for the watershed as

thumblarge

Where, A1, A2…An are the areas of the watersheds having respective runoff q1, q2….qn. The weighted runoff approach was again extended to quantify the total amount of runoff from the entire area.

RESULTS AND DISCUSSION

Thiessen polygon maps were generated for all the watersheds, as shown in Figure 5. Watershed B1 was influenced by less station and watershed B3 was influenced by more raingauge stations.[15-19] CN map for whole area was generated, as shown in Figure 6. It was observed that in case of watershed A1, the average runoff coefficient was about 0.19 with correlation coefficient of 70%, with an average rainfall of 1192.52 mm in 25 years. In watershed A2, the average runoff coefficient was about 0.18 with correlation coefficient of 74.5%, with an average rainfall of 805.38 mm. In watershed A3, the average runoff coefficient was about 0.16 with correlation coefficient of 80.8%, with average rainfall of 1913.76 mm in 25 years, and maximum rainfall of 2441.48 mm in 1997. In watershed A4, the average runoff coefficient was about 0.33 with correlation coefficient of 89.56%, with an average rainfall of 3046 mm. In watershed B1, the average rainfall was about 875.16 mm with correlation coefficient of 82% and maximum rainfall of 1205 mm in the year 2005. In watershed B2, the average rainfall was about 764 mm with maximum of 1048 mm in 2010 with correlation coefficient of 70%; in watershed B3, the average rainfall was about 1087.64 mm with maximum of 1485 in 2010 and minimum rainfall of about 622 mm in 2003; and in watershed B4, the average runoff coefficient was about 0.24 with correlation coefficient of 90% and average rainfall of about 2727 mm. The weighted of all these values gives the amount for the total area as rainfall varies from 1042.65 to 1912 mm from 1991 to 2015 with an average value of 1486.80 mm; the runoff of these areas varies from 170.12 to 599.84 mm with the average value of 342.99 mm. The correlation coefficient of the total area is as high as 86%. Figure 7 gives rainfall and runoff of depth of each watershed. Figure 8 give the correlation between rainfall and runoff for all the watersheds. Runoff volume of Watershed A1 is shown in Table 5. Runoff volume of Watershed A2 is shown in Table 6. Runoff volume of Watershed A3 is shown in Table 7. Runoff volume of Watershed A4 is shown in Table 8. Runoff volume of Watershed B1 is shown in Table 9. Runoff volume of Watershed B2 is shown in Table 10. Runoff volume of Watershed B3 is shown in Table 11. Runoff volume of Watershed B4 is shown in Table 12.

Table 5: Runoff for watershed A1

thumblarge

Table 6: Runoff for watershed A2

thumblarge

Table 7: Runoff for watershed A3

thumblarge

Table 8: Runoff for watershed A4

thumblarge

Table 9: Runoff for watershed B1

thumblarge

Table 10: Runoff for watershed B2

thumblarge

Table 11: Runoff for watershed B3

thumblarge

Table 12: Runoff for watershed B4

thumblarge
thumblarge

Figure 5: (a-h) Thiessen polygon map

thumblarge

Figure 6: Curve number map

thumblarge

Figure 7: (a-g) Rainfall-runoff yearly depth

thumblarge

Figure 8: (a-g) Rainfall-runoff correlation

CONCLUSION

The SCS curve number method uses, minimum data as input, and gives reliable output by using remote sensing and GIS techniques in most efficient way. The purpose of this study was to evaluate the performance of the procedure using land cover database from remotely sensed data. From the Table 13 it is observed that during the year 2007 maximum runoff depth of 599.84 mm has occurred. It was also observed that the minimum runoff depth of 170.12mm has occurred in the year 2003. The values of correlation coefficients are very high as it ranges from 0.79 to 0.95 Watershed A4 has high value of it. The value of runoff coefficient varies from 0.16 to 0.31. Hence, it can be said that there is a strong positive linear dependence between the annual rainfall and annual runoff and it can be observed that in the regression equation as the values of slope increases the runoff generated also increases. Figure 9 shows rainfall and runoff of upper cauvery from 1991 to 2015. The runoff estimation carried out by using SCS curve number method will help in proper planning and management of catchment yield for better planning of river basin.

Table 13: Runoff of upper Cauvery

thumblarge
thumblarge

Figure 9: Rainfall-runoff of upper Cauvery

REFERENCES

1. Bell FC. Generalized rainfall-duration-frequency relationship. J Hydraul Eng 1969;95:311-27.

2. Bernard MM. Formulas for rainfall intensities of long durations. Trans ASCE 1932;96:592-624.

3. Bhaskar NR, Parida BP, Nayak AK. Flood estimation for ungauged catchments using the GIUH. J Water Resour Plan Manag 1997;123:228-38.

4. Rashid MM, Faruque SB, Alam JB. Modeling of short duration rainfall intensity duration frequency (SDR-IDF) equation for Sylhet city in Bangladesh. ARPN J Sci Technol 2012;2:92-5.

5. Parvez MB, Inayathulla M. Generation of intensity duration frequency curves for different return period using short duration rainfall for Manvi taluk Raichur district Karnataka. Int Res J Eng Manage Stud 2019;3:1-20.

6. Chow VT, Maidment DR, Mays LW. Probability, risk and uncertainty analysis for hydrologic and hydraulic design. In:Applied Hydrology. Ch. 10. New York:McGraw-Hill;1988. 361-98.

7. Parvez MB, Inayathulla M. Prioritization of subwatersheds of Cauvery region based on morphometric analysis using GIS. Int J Res Eng Appl Manage 2019;5:85-94.

8. Parvez MB, Inayathulla M. Modelling of short duration isopluvial map for Raichur district Karnataka. Int J Sci Adv Res Technol 2019;5:973-6.

9. Parvez MB, Inayathulla M. Morphometry, hypsometry analysis and runoff estimation of Aam Talab watershed Raichur, Karnataka. Int J Adv Res Innov Ideas Educ 2019;5:1713-27.

10. Parvez MB, Inayathulla M. Generation of short duration isohyetal maps for Raichur district Karnataka. Int J Adv Res Innov Ideas Educ 2019;5:3234-42.

11. Parvez MB, Inayathulla M. Derivation of intensity duration frequency curves using short duration rainfall for Yermarus Raingauge station Raichur district Karnataka. Int J Innov Res Technol 2019;6:1-7.

12. Parvez MB, Chalapathi K, Inayathulla M. Geomorphological analysis of two mini-watersheds in Raichur city Karnataka. Int Res J Eng Technol 2019;6:2896-901.

13. Parvez MB, Inayathulla M. Geomorphological analysis of landforms of upper Cauvery Karnataka India. Int J Sci Res Multidiscip Stud 2019;5:33-8.

14. Parvez MB, Chalapathi K, Thankachan A, Inayathulla M. Modelling of intensity-duration frequency curves for upper Cauvery Karnataka through normal distribution. Int J Innov Technol Explor Eng 2019;9:4480-502.

15. Parvez MB, Inayathulla M. Multivariate geomorphometric approach to prioritize erosion prone watershed of upper Cauvery Karnataka. World Acad J Eng Sci 2019;6:7-17.

16. Parvez MB, Inayathulla M. Assesment of the intensity duration frequency curves for storms in upper Cauvery Karnataka based on pearson Type III extreme value. World Acad J Eng Sci 2019;6:26-46.

17. Parvez MB, Inayathulla M. Estimation of surface runoff by soil conservation service curve number model for upper Cauvery Karnataka. Int J Sci Res Multidiscip Stud 2019;5:7-17.

18. Parvez MB, Chalapathi K, Thankachan A, Inayathulla M. Isopluvial maps of daily maximum precipitation for different frequency for upper Cauvery Karnataka. Prax Sci Technol J 2019;8:20-38.

19. Sherman CW. Frequency and intensity of excessive rainfall at Boston, Massachusetts. Trans Am Soc Civ Eng 1931;95:951-60.