DATA AND METHODOLOGY
In this study of IGNP canal command, area remote sensing data are used. Landsat 8 Operational Land Imager and thermal IR sensor, enhanced thematic mapper (TM) +, and TM data for November, February, and March 1999, 2010, 2011, 2015, and 2016 for Stages I and II.[5]
Image enhancement models (normalized difference salinity index [NDSI], normalized difference vegetation index [NDVI], and normalized difference water index [NDWI]) and Gaussian classification were applied to identify the hot spots of waterlogging and soil salinity
NDWI = (Green-NIR)/(Green+NIR)
NDSI = ([Red-IR]/[Red+IR] and NDVI=[NIR-Red]/[NIR+Red]).[6]
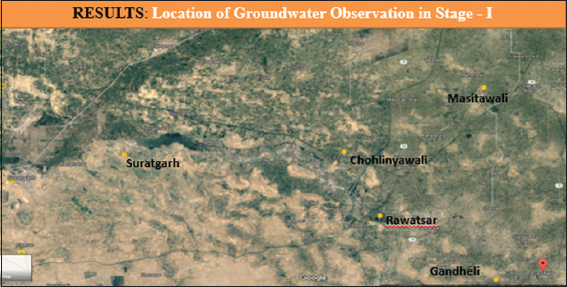
For field data survey, analysis of soil sampling and groundwater observation is done in Suratgarh, Chohlinyawali, Rawatsar, Gandheli, and Masitawali districts of Rajasthan. Saline soil is clearly visible in Suratgarh region. A waterlogged region is saw in Google earth image. It is also observed that most of the parts of canal are saline due to the waterlogging. This observation is located in Google earth image and there is sandy area in Suratgarh, this is one of the most causes in Suratgarh for salinity, but Masitawali and Chohlinyawali districts are covers with sandy areas.[7]
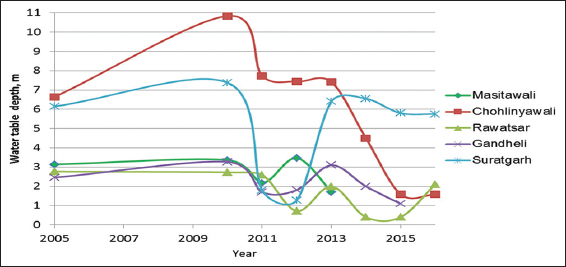
The groundwater level during 2005–2015 in the pre-monsoon season comprising in Stage I is average in Rawatsar, Masiwali, Gandheli, and slightly higher in Suratgarh and more high in Chohlinyawali. If the water level is less, then there is a least saline area and if water level is high, then there is a possibility of high salinity.
The IGNP has contributed significantly toward agriculture development and enhancement of crop production; however, in the wake of irrigation development, the problems of rising water table and salinity development have emerged.[8]
Water table has been monitored in the project area since inception of the IGNP but more vigorously since 1980–1981 by the groundwater department (GWD). Observations indicate a continuous rise of water table in the project area since the introduction of irrigation. During 1921–1990, the annual rate of rise has varied from 0.7 to 1.17 m with a mean of 1.10 m. Water table was mostly between 15 and 40 m before the start of the project with introduction of irrigation, the water table has built up progressively. As per GWD norms, the water table between 6 and 1.5 m from the soil surface is considered sensitive and that within 1.5 m from the surface is considered critical.
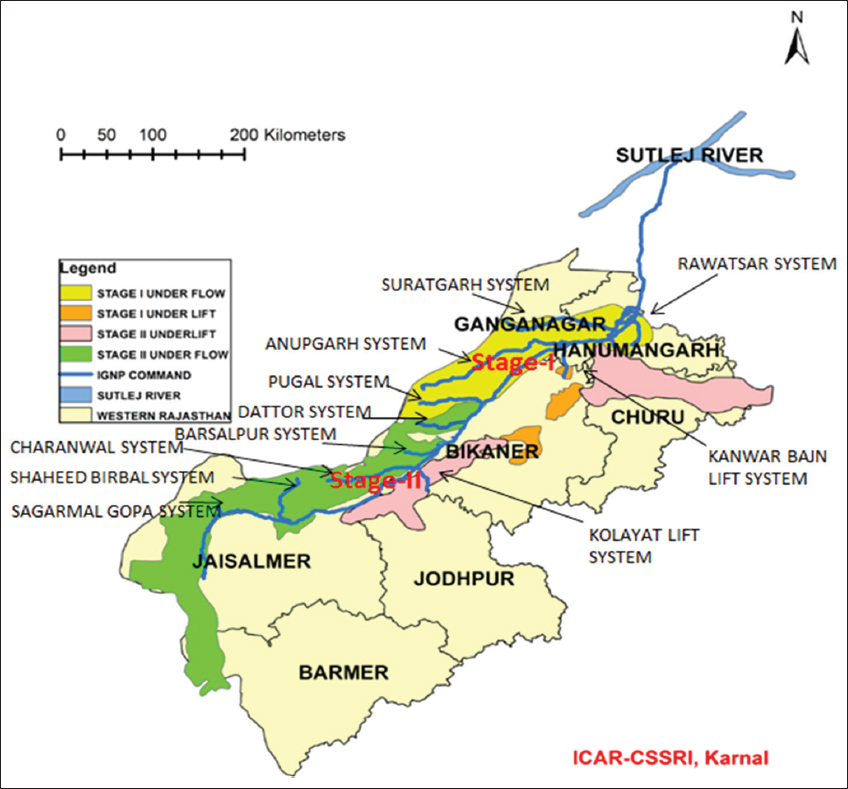
With the water allowance designed relatively on a high side in Stage I, addition to the groundwater and rise in water table could be expected unless there is a provision for drainage of the excess water. Moreover, as the command area developed relatively rapidly up to 74 km of IGNP and much slowly beyond 74 km, the water drawn from the Harike Barrage for the entire command area was mostly utilized in the developed command area up to 74 km. Beyond 74 km, a potential of 1.72 lac hac has been created but only 0.37 lac hac has been commanded. Delta of irrigation lac hac has been created but only 0.37 lac hac has been commanded. Delta of irrigation in Stage I has been very high ranging from 2.02 m for Kharif and 1.73 for Rabi with average of 1.43 m correspondingly in 1984–1985. The delta has come down in recent years to around 1 m which is much higher than the stipulated value of 0.51 m in Stage I. Direct outlets for main canals to the farm holding continue to draw unlimited supply of water. The situation of over irrigation, initially around out of concern to make use of the allotted share of water from the Harike Barrage, is perpetuating as the farmers are attuned to use more water than optimally required by the crops.[9]
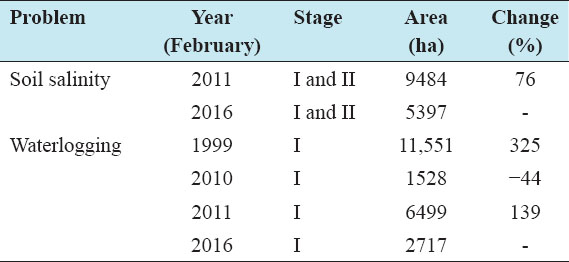
The land in the area does not have much capacity of water absorption. In many areas, the upper layer of the soil has got a rocky layer of calcium carbonate and the kankar pan is only 4–10 ft. below (e.g., Kola block in Stage I and 1120–1190 Rd in Stage I). Due to this, surplus water cannot go inside and water gets collected on the surface giving rise to the problem of waterlogging in the area. This has led to serious waterlogging situations in areas where seepage from the system is substantial which adversely affects the hydrological regime [Table 1]. Pools of stagnating water along with the main canal and also to an extent along with the Suratgarh branch and some of the distributaries bear evidence to this. It is estimated that about 13% of the water released at the Harike Barrage is lost in seepage during conveyance and distribution. Thus, about 0.6 m water is being added daily to groundwater in the IGNP command. The seepage from the canal network has increased because of defect/damage in the lining. It is understood that if the damaged portion is more than 5% in a lined canal system, the system as whole behaves like an unlined canal system, the system as a whole behaves like an unlined maintenance. The watercourses in Stage II are mostly online, and hence, higher seepage losses can be expected.[10]
Table 1: Problems in soil salinity and waterlogging in table
The Stage I heavy waterlogging was observed at Dublikala, Lunawali Dhani, Tivan Nagar, Lakhuwali, Jakarwali, Baropal, Manak Kheri and Rangmahal. Existing plantation near due to waterlogging conditions.
At Jakarwali due to waterlogging, the entire village has been abandoned. In Stage II, though the problem is not to so alarming proportions. Heavy waterlogging could be seen at a few places near 1115 Rd. It has been noticed that species like Tamarix aphylla are surviving and naturally regenerating at many such waterlogged areas. Migrating birds could also be seen in large number in such places [Figures 1-11].
Figure 2: Ground truth observation in Stage I
Figure 3: Average rainfall in Stage I
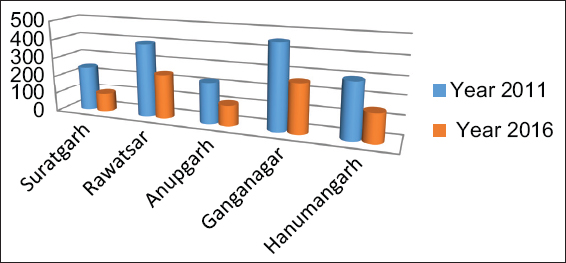
Figure 4: Pre-monsoon table in Stage I
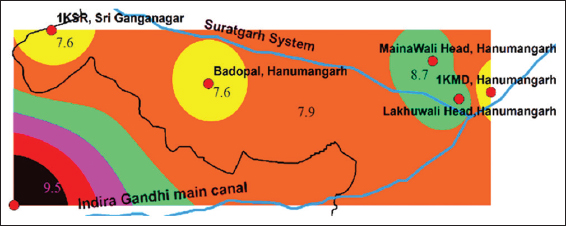
Figure 5: pH level in Suratgarh area
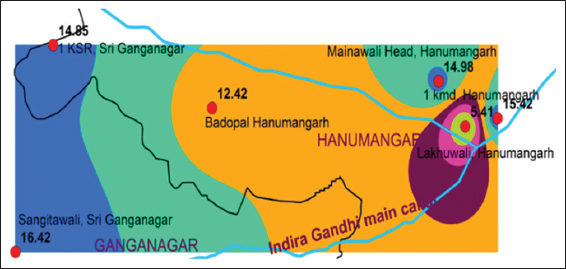
Figure 6: Ec level in Suratgarh area
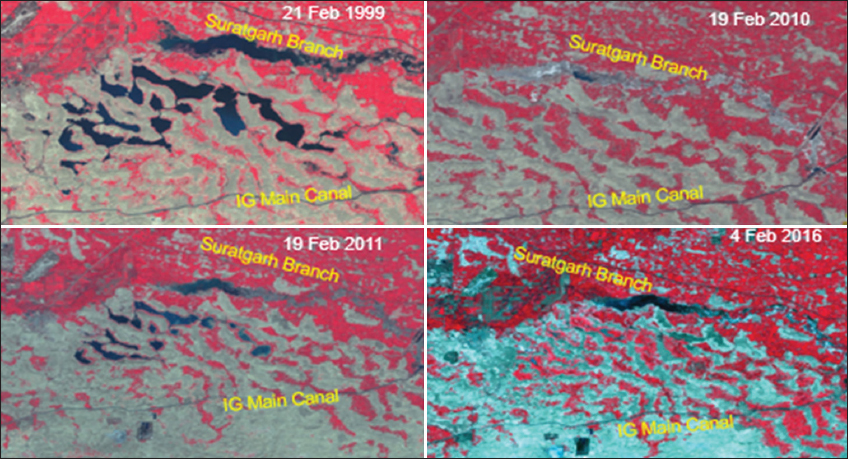
Figure 7: Landsat 8, February 1999, 2010, 2011, and 2016
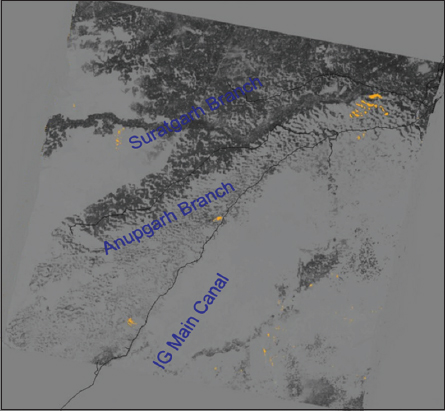
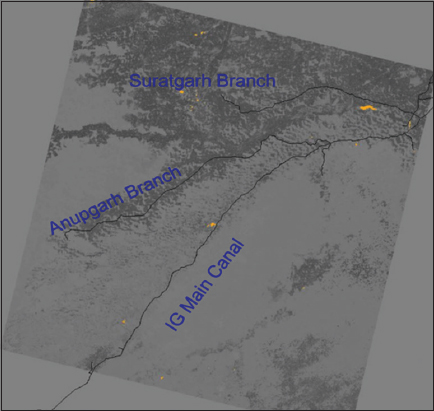
Figure 8: Normalized difference salinity index, February 19, 2011
Figure 9: Normalized difference salinity index, February 4, 2016
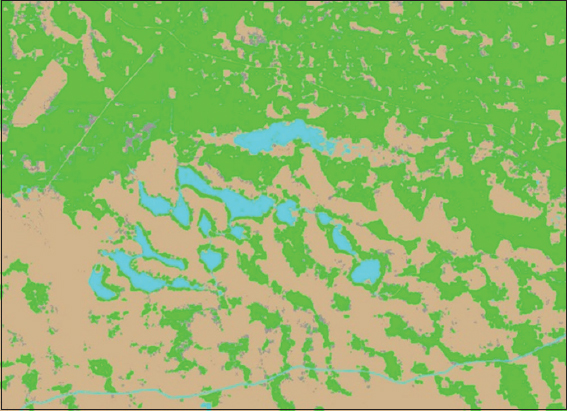
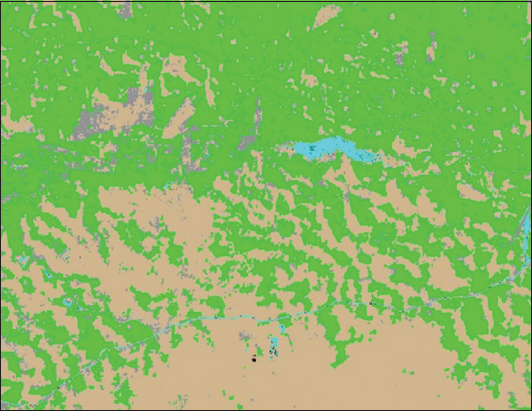
Figure 10: Normalized difference water index, February 19, 2011
Figure 11: Normalized difference water index, February 19, 2011
Around the main canal system, this problem becomes so serious that no irrigation works are possible. Underground water board has declared the whole area not only waterlogged but also unfit for irrigation purposes. Pre-irrigation surveys indicated that salt-affected soils occupied an area of about 1.13 lac hac in the project area, located mainly in Eastern Block, Anupgarh branch and soil salinity and waterlogging in Rajasthan.
Suratgarh branch – except that the soils in the Anupgarh branch are mostly alkaline, the soils in the other areas were mainly saline of which a sizeable part has been reclaimed through leaching as irrigation expanded. However, it is a known fact that the rise in water table is usually accompanied with salinity development depending on the depth and salinity land of groundwater. The available data for the year 1983 showed that 46% of the groundwater samples had a dissolved salt content of 3000 mg/l or more. Salinity is bound to develop in such areas with water table rising to within 2 m of the soil surface.
Many measures have been planned by the department of command area development in IGNP such as (a) reduction in excess supplies of water allowances in Stage I till irrigation in Stage II develops considerably, (b) increase in irrigation area, (c) reduction in number of days of running of canals, (d) removal of excess outlets and correction of oversized outlets and direct outlets, (e) remedial measures in canals to control seepage through damaged lining, (f) installing shallow skimming wells along with infiltration gallery, and (g) installation of subsurface pipe drainage system.
Biodrainage is a cost effective but long-term process for the reclamation of waterlogged areas, preventing/delaying waterlogging. For this purpose, the following activities may be taken up as per the requirement of the affected sites.
Pre-monsoon water table depth data of the Stage I command from 2005 to 2016 were analyzed and found that water table is within 2 m at Masitawali, Chohlawali, and Gandheli under critical[11] waterlogged and potential waterlogging in 2016.
The Ec and pH level in Sri Ganganagar is 14.85 and 7.6; in Badopal village of Hanumangarh district is 12.42 and 7.6; in Mainawali Head village of Hanumangarh district, the Ec and pH level is 14.98 and 8.7; in Lakhuwali village of Hanumangarh district, the pH is 5.41; and in Sangitawali village of Sri Ganganagar district, the Ec and pH level is 16.42 and 9.51.
There are four different Landsat images of different years showing waterlogging and salinity near the IGNP canal command. Four images of Landsat during the years of 1999, 2010, 2011, and 2016.[12] In all 4 years during 1999, the waterlogging area is more in the Suratgarh branch. Below Suratgarh branch, there are sandy areas and above the canal, there is a crop irrigated area. We can easily see 2010[13] image the salinity is more.
There are two different images of 2011 and 2016.[14] In this image, IGNP canal command, there is the main command and the two subbranches, i.e., Suratgarh branch and Anupgarh branch. In this, Normalized salinity difference index = ([Red-IR]/[Red+IR]). As compared to 2011–2016,[15] salinity is more as compared to 2016 in 2011, the salinity is 9484 ha and in 2011, salinity is 5397 hectares. The changes are 76%. The Suratgarh branch is the main branch of IGNP command. In Anupgarh branch, salinity remains same in 2011 and in 2016. However, in Suratgarh branch due to more waterlogging area, salinity is more in 2011 as compared to 2016.[16]
Three major hot spots of salinity were identified using spectral salinity index (NDWI) and these were monitored in 2011 and 2016.[17] The waterlogging area is 6499 ha in 2011 and 2717 ha in 2016. Area under waterlogging was reduced from 6499 to 2717 ha (−43% change).