INTRODUCTION
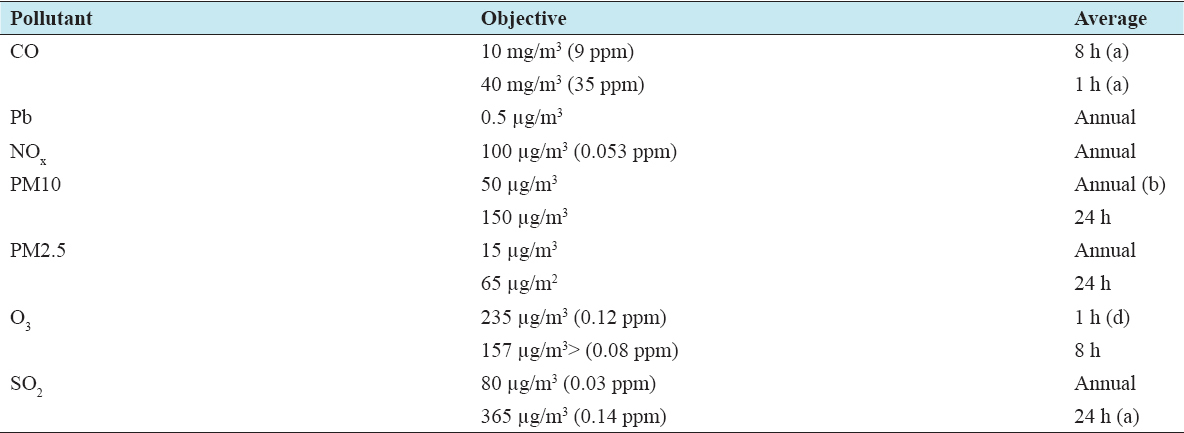
This paper mainly takes 4 CAMS data of Dhaka city of the past 6 months from September 2016 to February 2017. The elements that are mainly responsible for the air pollution are sulfur dioxide (SO2), carbon monoxide (CO), particulate matter (PM), ozone (O3) PM2.5, and PM10. SO2, a noxious gas mainly occurs due to human activities such as making fine dust and industrial activity such as making electricity from coal and oil that contains sulfur. It harms human health. Normally, CO is very poisonous for humans if it crosses its concentration limits (35 ppm). PM2.5 and PM10 are PM which contains lead and harmful matter in the atmosphere.
There are a total of 42 component attributes in our past 6-month data. Taking SO2-(24 h), CO-(1 h), CO-(8 h), O3-(1 h), O3-(8 h), PM2.5-(24 h), and PM10-(24 h). By applying J48 algorithm is an extended version of C4.5 algorithms. With this, a tree is made to model the classification process in decision tree denotes a test on an attribute. Model generated from decision tree helps to predict new instances of data.
Data mining can be called such a tool by which we can define the interlink or relationship between multiple data instances and make authentic and valid predictions.[16,17] Data mining techniques can also be used by support vector machine (SVM), rule-based technique, neural networking, nearest neighbor, genetic technical algorithms, and so on.
I have taken multiple variable average values by different indications (1 h and 8 h average value). Classification rules area which shows the path to jointly predict multiple class dependence variables.
RELATED WORK
In Rubby et al.[1] analyzed on his research paper on air pollutant and respiratory health risk that comes along with such air pollutants and classified them using k-means clustering method and the CART method. The accuracy of the decision trees used in this paper is for 1a = 62.5%, 1b = 58.5%, 1c = 51%, 1d = 49%, 2a = 55.5%, 2b = 45.5%, 2c = 48%, 2d = 54.5%, 3a = 29%, 3b = 33.5%, 3c = 28.5%, and 3d = 35%.
Amornsinlaphachai[2] researched on his paper the efficiency of cooperative learning in computer programming subjects and predicts the learners’ academic performance. In this paper, author used a total of seven data mining algorithms which are Artificial Neural Network, K-Nearest Neighbor, Naïve Bayes, Bayesian Belief Network, JRIP, ID3, and C4.5. The accuracy of the C4.5 model is about 74.8945%, and Bayes model is about 65%.
Hochsztain et al.[3] wrote a paper on data mining applications in entrepreneurship analysis where they have used the following data mining techniques association rules, decision trees, and logistic regression.
Jawad et al[4] also work on to analyze the reason for home birth in Bangladesh the data mining techniques used for analysis are decision tree, Neural Network, Bayes classifier, Ripper, and SVM. The accuracy level for decision tree is 88.2%, for Naïve Bayes 93.5%, for Neural Network 68%, for Multi-Layer perception 89.4%, and accuracy level, and SVM is 87.9%.
In Mane et al.[5] used classification technique such as Hybrid NSGA II, NSGA II, and HMON to tackle multi-objective problem. In this paper, the accuracy of Hybrid NSGA II is 92.5%, NSGA II is 91.3%, and HMON is 86.07%.
Ni et al.[6] present correlation analysis, prediction, and potential related factors of PM 2.5. For the analytical portion of this paper the authors used multivariate statistical analysis method and BP Neural Network, and for the prediction portion, they used ARIMA Time series model.
In Niu and Niu[7] worked on the comparative analysis of statistical model in rainfall prediction. This analysis was done by Naïve Bayes, SVM, and BP Neural Network. The accuracy level of NB for RO is 74.01% and RR is 74.41%. SVM for RO is 79.09% and RR is 73.23% and BPNN for RO is 79.91% and RR 76.93%. In[8] Shazzad Hossain researched on user submitted bug reports using text classification algorithm. Five different machine learning algorithm is used to classify the bug report, and these are Naïve Bayes, KNN, Pegasos, Rocchio, and Perceptron. The average accuracy level of Perceptron is 72.31%, for Pegasos is 69.69%, for NB is 62.51%, for KNN is 57.24%, and for Rocchio is 69.23%.
In Zhu et al.[9] worked on Dynamic Dyadic Data Prediction on Bayesian Non-parametric Approach. They used the Dirichlet Process and Vector auto-regressive model (VAR). In Wang[10] analyzed marketing data using data mining technology, and the algorithms are FP growth and basic association rule.
Karim and Rahman[14] tried to focus on Decision Tree and Naïve Bayes Algorithm for Classification and Generation of actionable Knowledge for Direct Marketing. The authors take 45211 data records and applied CRM, C4.5 Naïve Bayes, receiver operating characteristic (ROC), classification.
Joshi and Nair,[15] Karim and Rahman.[14] Nair have focused on predicting Heart disease using Classification based Data Mining Techniques. The authors used Decision tree, Naïve Bayes, K-Nearest neighbor techniques.
In this paper, I have tried to enlighten the classification rule within data mining techniques. So far, I tried to focus on two algorithms which are called J48 and naïve Bayes algorithms. I have shown the comparative result which algorithm is better than each other. I have also analyzed the data and founded many types of situations which defer the algorithms correctly such as finding the confusion matrix and visual classification error and explicating the data based on the CAMS.
DATA SOURCES
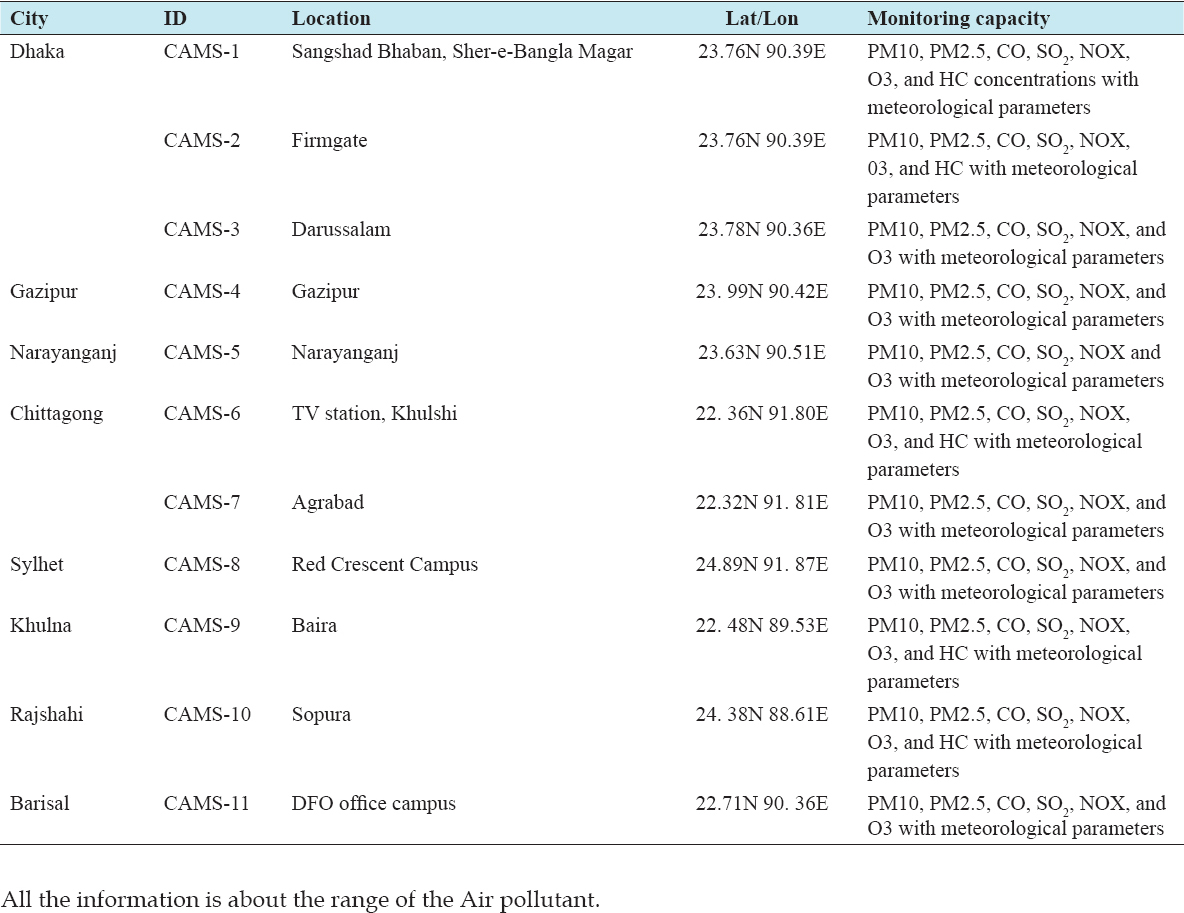
For analyzing air pollution, I collected data from clean air and sustainable environment Project from the Government of the People’s Republic of Bangladesh, Ministry of Environment and Forest. I analyzed the last recent 6 months’ data of our environment. Dhaka has total 4 CAMS located at different paces to analyze the pollution components such as SO2, CO, O3, PM2.5, and PM10. They are plotted as minimum, maximum, and average value into their corresponding places. I have taken the average value of our specific data location.
METHODOLOGY
Classification can be used to specify an unique analyzing and predicting value of a corresponding situation based on the different mathematical concept. These can be statistical, distance-based, tree-based decision structure, rule compiling based, and neural network based.
In this paper, I used 2 algorithms for some analyze and some predicting values of Air pollution of Megacity like Dhaka, Bangladesh. For building the decision tree I have used free software for data mining, WEKA[12] under the General Public License. 2 Algorithms are:
-
Weka, classifier, j48
-
Weka, classifier, Naïve Bayes: Naïve Bayes.
Although J48 algorithm is an extension step of C4.5 Algorithm, In J48 algorithm, a tree is made to the model in the classification technique in decision tree. The internal nodes are dependent on the attribute. The branches represent the outcome of the process.
-
Algorithm[11] J48
-
1:IN P U T = D. Denotes the data of training
-
2:OU T P U T = T. Denotes the decision tree
-
3:DT BU ILD(D). Decision Tree build
-
4:{
-
5:T = Null
-
6:T = Creating loop nodes by labeling splitting attributes.
T=For each split predicting and labeling, adding arc to root node.
D= Database created applying predicate splitting to D.
-
7:if stopping point reach this path then
-
8:T’ = Creating leaf nodes by labeling appropriate class
-
9:else
-
10:T0 = DT BUILD
T = Add T’ to arc
-
11:end if
-
12:}
-
J48 algorithm usually ignores the missing values it allows classification by either rule generated or decision tree from them.
Naïve Bayes Algorithm
Statistical classification[14] is used widely for its natural simplicity and enhancing the training speed. The epithet naïve indicates the terms independence assumption. That means the distribution of joint terms is the product of marginal. Naïve Bayes algorithm is the probability of data instance.
Classification indicates step by step indication that how a new data instance can be determined, Naïve Bayes classification. The probability is measured for all classes. The flowchart[14] of this algorithm is defined in Figure 2 below:
DATA ANALYSIS
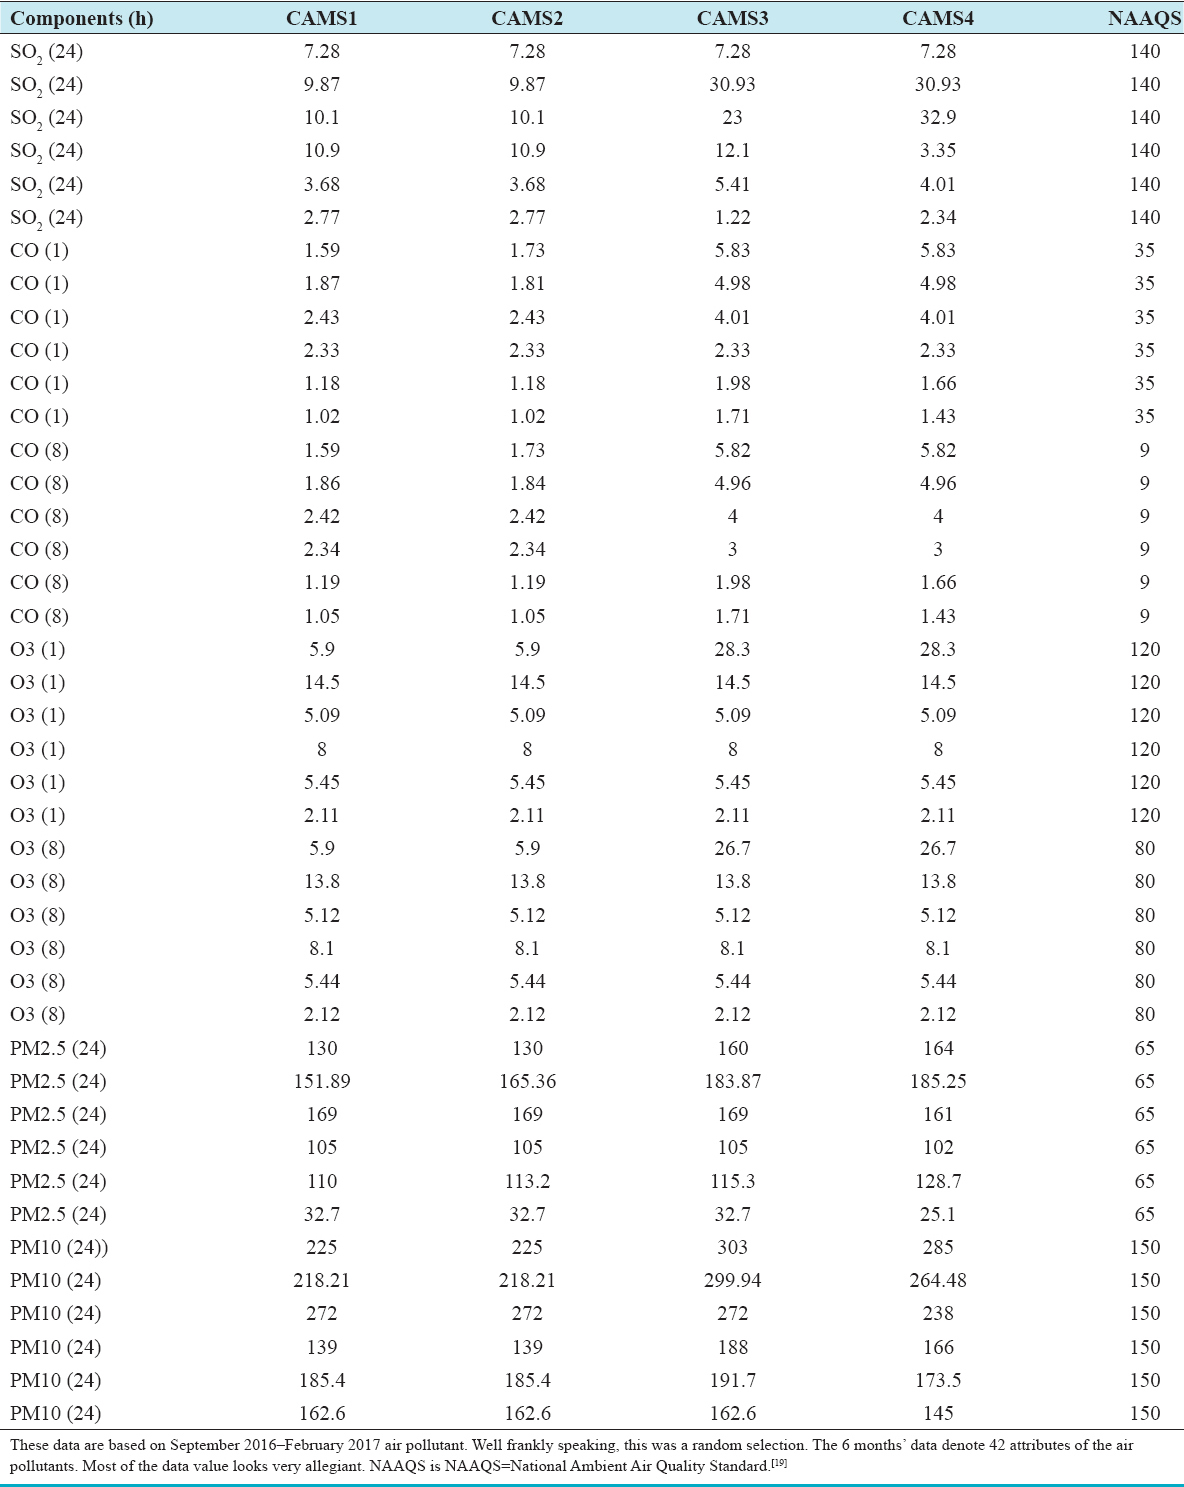
I have taken Data from past September 2016 to February 2017 having total 42 component attributes. Here, I am going to use the data under J48 algorithm and Naïve Bayes classification method of WEKA Figure 1.
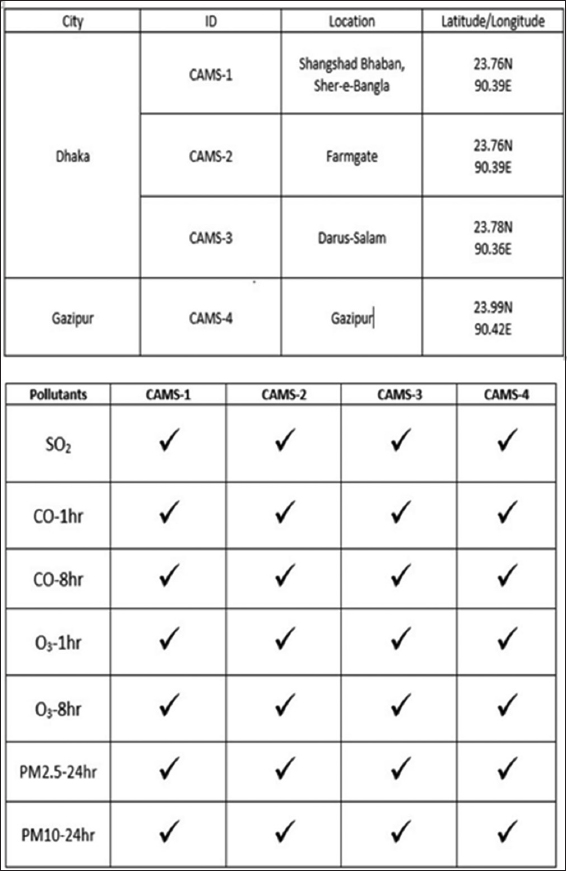
Figure 1: Air pollutant records[19] (Details on Table A1, A2, A3)
Area Under Curve (AUC)
AUC is defined as the area under the ROC curve. Classification rule corrects accuracy is based on high values. Sizes of the rules set are incredibly reduced. However, the technique is set to have a good ability to estimate structural probability.[13] ROC indicates as ROC graphical presentation, and that is another way to examine the performance of a specific or multiple classifiers. X-axis indicates false positive rate and Y-axis indicates true positive rate. (0,1) Analyze all negative and positive rate. It is called a perfect classifier. It is considered as (0,1) because the true positive rate is all 1 and false positive rate is 0 for none. On the other hand, (0,0) points indicate all the negative cases. (1,1) Says to classify to predict every case positive. (1,0) Points to be incorrect classifier for all. I have shown a bunch of examples on J48 and Naïve Bayes algorithm ROC curves. If I judge Figure 3 yes and Figure 4 no, it is shown that Y-axis which is said to be true positive as it seems to be really closer to Y. ROC of yes is more accurately and comparatively closer than ROC no of Figures 10 and 11 in Naïve classification. It is a sign of really nice classification.
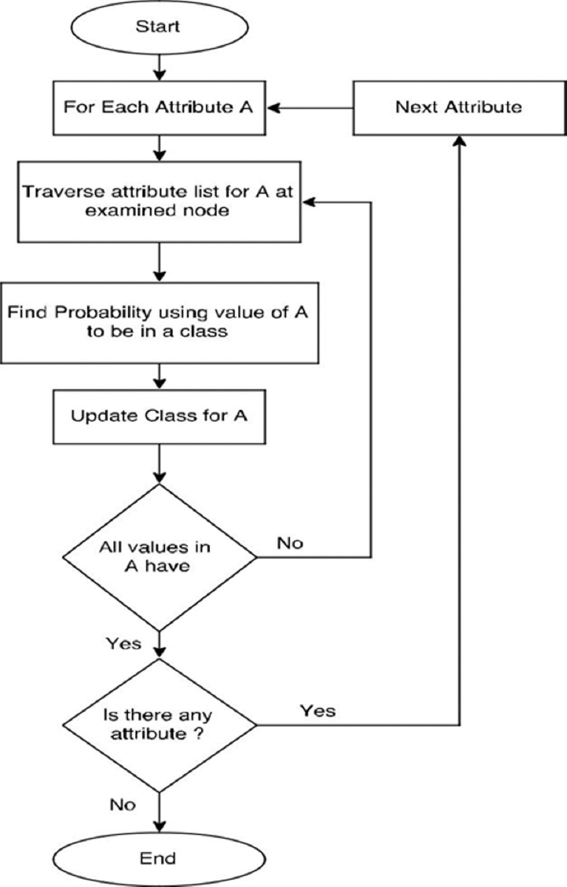
Figure 2: Flowchart of Naïve Bayes decision tree algorithm
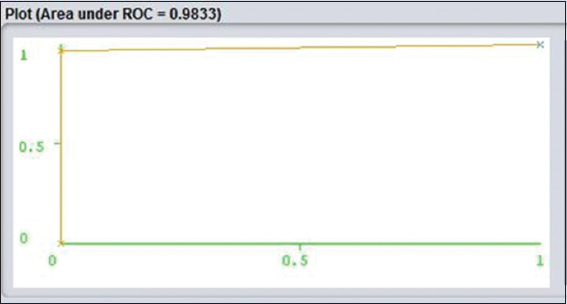
Figure 3: 48 Receiver operating characteristic curve class for Yes
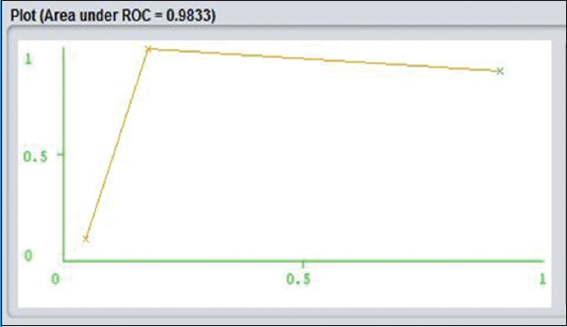
Figure 4: J48 receiver operating characteristic curve class for No
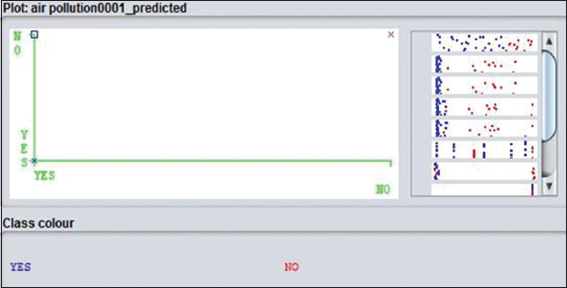
Figure 5: Visual classification error of J48
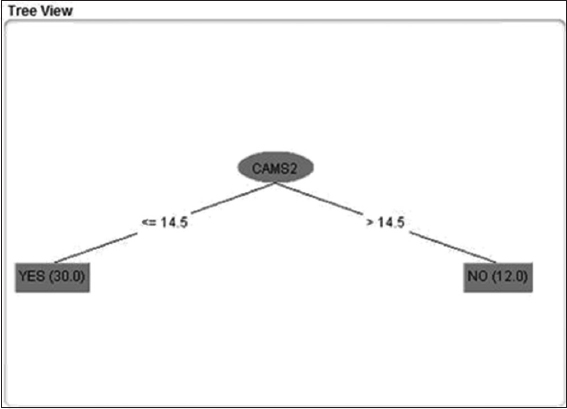
Figure 6: Splitting based on CAMS 1 (S-Bhaban)
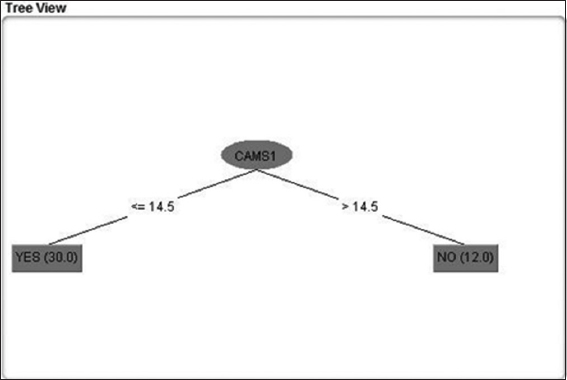
Figure 7: Splitting based on CAMS 2 (Farmgate)
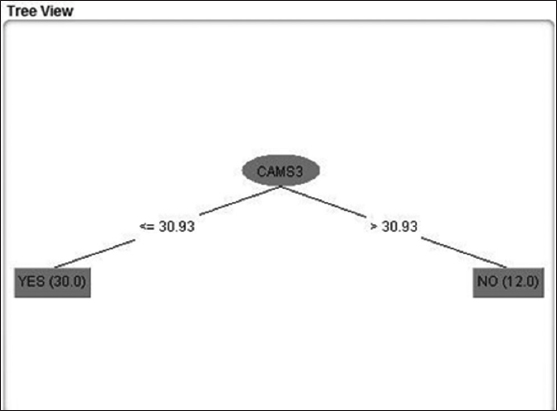
Figure 8: Splitting based on CAMS 3 (Darussalam)
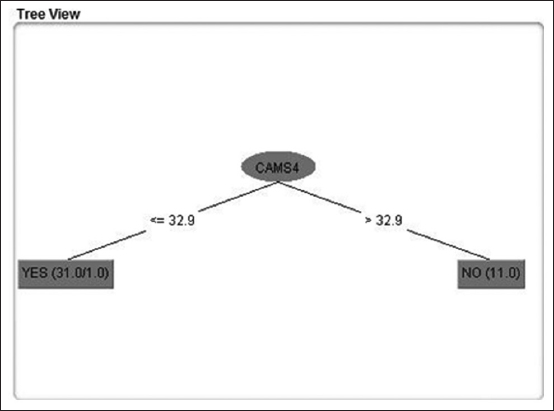
Figure 9: Splitting based on CAMS 4 (Gazipur)
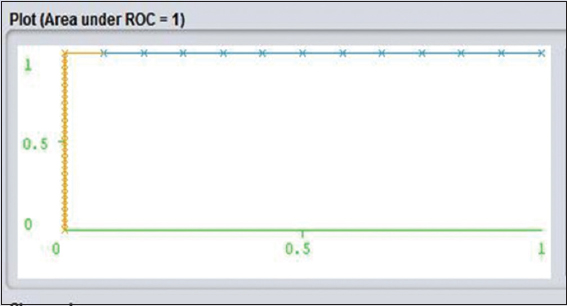
Figure 10: Naïve bayes receiver operating characteristic classification for Yes
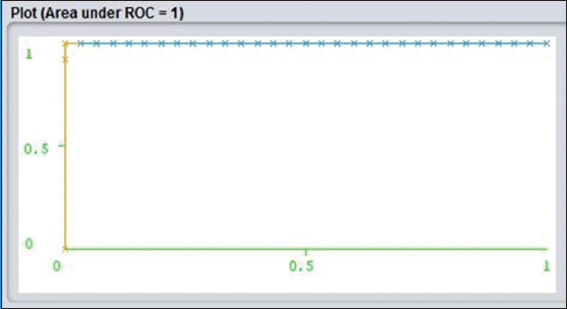
Figure 11: Naïve bayes receiver operating characteristic classification for No
Precision
The definition is said to be the correct positive cases proportion with each other. Figures 5 and 11 show a visual error for both J48 and Naïve Bayes. Horizontal stripes are indicated as the right of the plot. An attribute is represented by each strips. The result of the classification is representing through the plotting. Correct instances are signed as crossed, and incorrect instances are shown in squares. The result of the correct and incorrect instance ratio is quite nice.
J48 Algorithm Analysis
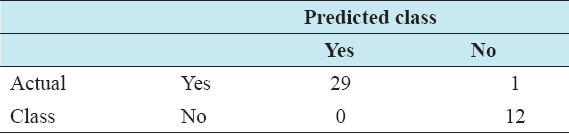
Using the algorithm, the training has total number of instances 42, and correctly classified instance is 41 with 97.619%, and 1 incorrect classified instance having 2.381%. Hence, there is no doubt that the training is good and can classify accuracy as well. A confusion matrix bears the information about the predicted and original classification. This kind of system performance is commonly examined by the confusion matrix. The following Table 1 is the confusion matrix.
Table 1: Confusion matrix using J48 algorithm
Using the algorithm, decision tree has been generated by selecting the best split at every node. At each node, the information gain is calculated. Here, the number of leaves is 15, and the size of the tree is 29. It has taken almost 0 s to build the tree, and that is the indication of how fast the algorithm.
This decision tree is a classifier in the state of the tree structure. Leaf node shows the attributes. Decision tree is an example where starting from a root of the tree to at the end of the nodes. It is an important matter to have sufficient data to generate a decision tree under J48 algorithm. The below decision tree Figures 6-9 are component based decision trees.
On the basis of splitting the decision tree in the following Figures 6-9 there has been analyzed that CAMS 1 and 2 has almost the same level of value and attribute. Yes, class denotes to the category of Healthy and No denotes to the level of Unhealthy. The total unhealthy class is 12 and healthy class is 30 in Figures 6-9.
Naïve Bayes Analysis
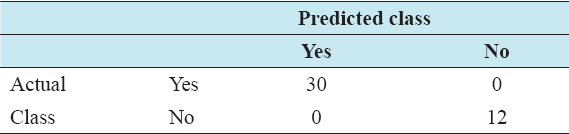
Naïve Bayes technique shows us some more points of view. Say, if the data contain millions of components or attributes, then the system will take more time to compute the desired model. However, the fact is, the more data are provided, the more accurate result I get. In our model the confusion matrix is below:
As seen in Table 2, there were 42 independent instances and got 42 correct classified instances with 100%. It also got almost 0 s to build. Hence, definitely, it is a better model than the previous one.
Table 2: Confusion matrix using Naïve bayes algorithm
The visualization shows that there are 42 components as an attribute and green color indicating healthy category class yes. Red category indicating unhealthy category class no. in CAMS 1, 2, 3, 4 it is visualizing the same thing as shown in Figures 6-9 splitting nodes. National Ambient Air Quality Standard (NAAQS) shows the average range of all 4 CAMS category (Figures 12 and 13).
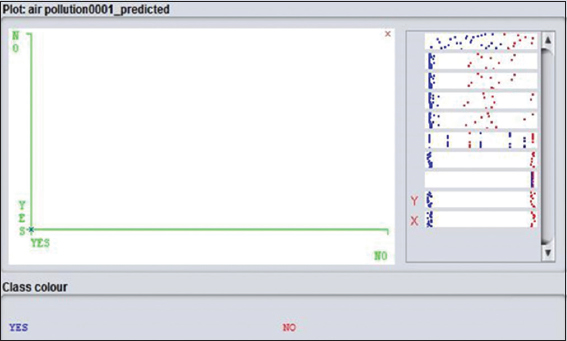
Figure 12: Visual classification error for Naïve Bayes algorithm
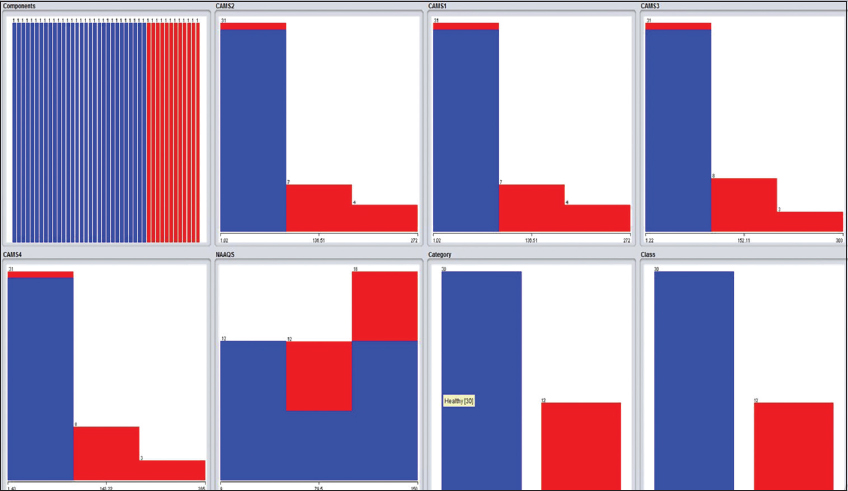
Figure 13: Visualization of air pollution data analysis
RESULTS ANALYSIS
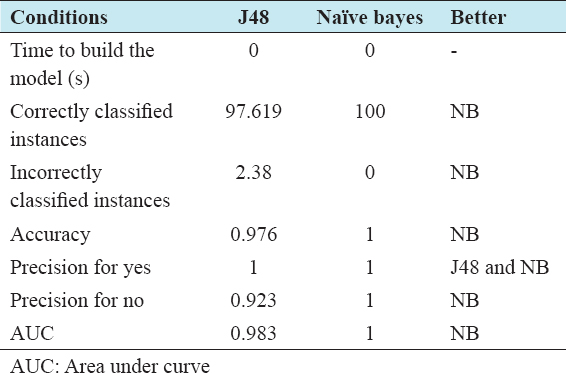
Although it is very difficult to judge to have complement which classification techniques is better than one another. But having the authentic data analysis and implementing them on WEKA we can easily build a model for our 2 algorithms: J48 and Naïve Bayes classification. If we evaluate table 3, we can see Naïve Bayes algorithm is more efficient comparing to each other.
Table 3: Predictor comparison
Model
Accuracy = (Number of correct classify instances)/(Number of total instances).[20]
CONCLUSION
A good predictor should have high accuracy and sensitivity. Whereas, in our model sensitivity and accuracy result is the same. The comparison of the measurement of 2 techniques is shown in Table 3. The experiments are done to analyze the pollution of Dhaka city on the attribute of advance Data mining. Naïve Bayes and J48 are very accurate machine learning techniques for classification of our problem. J48 also a good feature of classification.